Introduction

Goal
The aim is to :
  • Get familiar with motif analysis of ChIP-seq data.
  • Learn de novo motif discovery methods.
In practice :
  • Motif discovery with peak-motifs
  • Differential analysis
  • Random controls

Retrieving sequences from your peaks

Goal: Given a set of peaks from a ChIP-seq experiment in a bed format, retrieve the sequences corresponding to those coordinates from the genome in fasta format.

1 - Peak dataset: ER factor in human MCF7 cells

Theodorou et al published a ChIP-seq experiment in the MCF7 cell line (breast cancer) to identify genomic locations bound by the transcription factor Estrogen receptor alpha (ESR1)(PMID:23172872). The particularity of this system is that it is inducible with the E2 (oestradiol) hormone. The authors were interested in evaluating the role of another transcription factor (GATA3) They thus performed the following experiments (with E2 induction):

  • inhibiting the GATA3 factor by small interference RNA (files with prefix siGATA in the Table below)
  • control (files with prefix siNT)
List of all datasets published in this work. Peak regions were obtained by running the peak calling program MACS on the aligned reads (as in the previous session). The multi-peak regions were further split into individual peaks using the PeakSplitter tool. We then selected only the chromosome 7 for the sake of time during the practical.

Description of the peaks on chr7:
Peak BED file Number of peaks Sum of peak sizes (bp)
siGATA_ER_E2_r3_MACS_PeakSplitter.bed 7.041 1.476.646
siNT_ER_E2_r3_MACS_PeakSplitter.bed 6.991 1.801.622

2 - Fetch sequences from a bed file

  1. In a web browser window open the RSAT Metazoa server (http://metazoa.rsat.eu/)
  2. In the menu (left side) click on the NGS-ChIP-seq drop down menu, and select the tool: fetch-sequences from UCSC.
  3. Select the genome of interest, in this case: human, assembly hg19.
  4. Select the correct genome version: New genome assemblies are constantly updated with new annotations and sequences. Always verify you are selecting the correct version, corresponding to the coordinates (choice of assembly was made during the read mapping step).
  5. Genomic coordinates can be provided in 3 alternative ways:
    • Paste the content of the BED file, (not very convenient for large peak sets).
    • Specify a URL. This option is generally suitable for importing peaks from a Galaxy server or any other Web site.
    • Upload a file from your computer.
    In this case, to prevent traffic between the teaching room and internet, we will favor using the URL option. Right click on the first link in the table above (dataset siGATA_ER_E2_r3_MACS_PeakSplitter.bed) and "copy link location" to get the URL of the peak coordinates (BED) file. Paste it the the box.
  6. 1_fetch_seq.png
  7. Leave all other parameters unchanged and click on the button “GO”.
  8. What is the result of this fetch-sequences tool ?
    2_fetch_seq_result
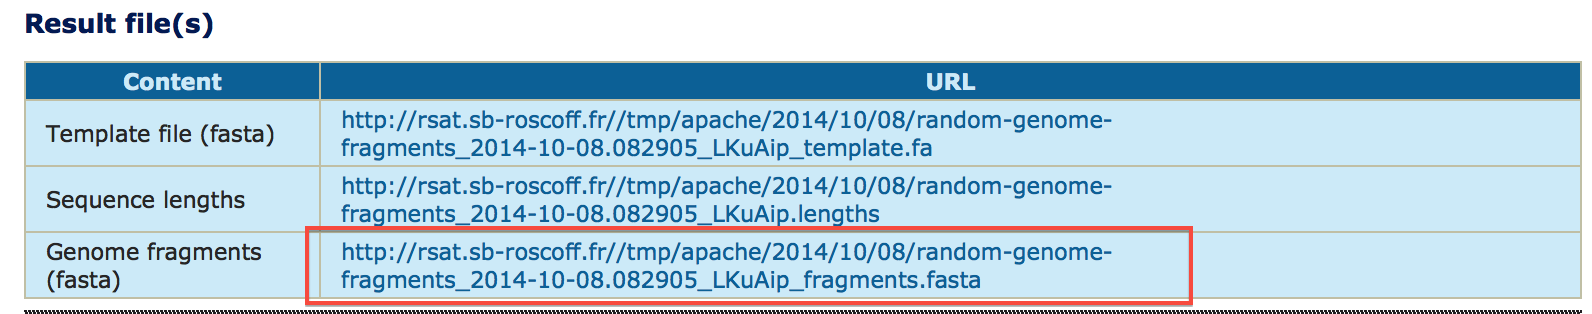
    The program returns 3 links to files :
    1. the input BED file (coordinates),
    2. the corresponding sequences (FASTA file), and
    3. a log text file providing information on the execution of the program.
  9. Click on the link to the log file, and look for the number of sequences retrieved.
  10. Always check that you retrieved all sequences.
    According to the table above, the coordinate BED file contain 7.041 regions. The log file has this line :
    ; sequences           	7041 
    All sequences were retrieved.
  11. The FASTA file contains the sequences. For the sake of safety and tractability, download it (right click, save as...) on your computer to keep a copy.
At this point, you should have retrieved the sequences corresponding to your coordinate (BED) file.

Discovering motifs from peak sequences

Goal:Discover binding motifs from a fasta file containing ChIP-seq determined binding regions of a transcription factor.

1 - Getting to know peak-motifs

peak-motifs is a computational pipeline that discovers motifs in peak sequences, compares them with databases, exports putative binding sites for visualization in the UCSC genome browser and generates an extensive report.
The following articles describe peak-motifs and its usage:
  • Thomas-Chollier, M., Herrmann, C., Defrance, M., Sand, O., Thieffry, D. and van Helden, J. (2011). RSAT peak-motifs: motif analysis in full-size ChIP-seq datasets Nucleic Acids Research doi:10.1093/nar/gkr1104, 9. [Paper]
  • Thomas-Chollier M, Darbo E, Herrmann C, Defrance M, Thieffry D, van Helden J. (2012). A complete workflow for the analysis of full-size ChIP-seq (and similar) data sets using peak-motifs. Nat Protoc 7(8): 1551-1568. [Paper]
In this section we will get familiar with this tool and its general usage.
  1. In the previous section, you used the RSAT tool fetch-sequences to retrieve sequences corresponding to ChIP-seq peaks. At the bottom of the fetch-sequences result page, click on the peak-motifs button to automatically transfer the sequences to this tool. Note that peak-motifs is also accessible from the left menu, in the NGS ChIP-seq, but this would give you an empty form, whereas the Next step button automatically transferred the fetched sequences to the peak-motifs form.
  2. A new page appears, displaying a form.
  3. 3_RSAT
  4. The default peak-motifs web form only displays the essential options. There are only two mandatory parameters.
    1. The title box, type a text that will allow you to remember the analysis, for example siGATA_ER_E2_r3.
    2. The sequences, that have been automatically passed from fetch-sequences. Alternatively, sequences can be pasted in the available box, input from a URL, and uploading a file from your computer.
  5. It is already possible to launch the analysis like this (with all other default options), but we will now modify some of the advanced options in order to fine-tune the analysis according to our data set.
    • Open the "Reduce peak sequences" title, and make sure that the option "Cut peak sequences: +/- " is set to 0 (we wish to analyse our full dataset)
    • Open the title “Motif Discovery parameters” title, and check the oligomer sizes 6 and 7 (but not 8). Check "Discover over-represented spaced word pairs [dyad-analysis]"
    • 4_RSAT
    • Under “Compare discovered motifs with databases”, we'll keep "JASPAR core vertebrates" as the studied organism is human.
    • Under “Locate motifs and export predicted sites as custom UCSC tracks”, select "Peak coordinates specified in fasta headers of the test sequence file (Galaxy format)".
    • 5_RSAT
  6. You can indicate your email address in order to receive notification of the task submission and completion. This is particularly useful because the full analysis may take some time for very large datasets.
  7. Click GO. As soon as the query has been launched, you should receive an email confirming the task submission, and providing a link to the future result page.
  8. The Web page also displays a link, on which you can already click. The report will be progressively updated and display intermediate results during the processing of the workflow.
  9. Understanding the peak-motifs result report .

    The peak-motifs output is formed by the following parts:
    1. Sequence Composition: the distribution of sequence lengths provides a useful way to detect outlier peaks (i.e., exceptionally long peaks that may ‘dilute’ the motif signal) or irregular length distributions resulting from problems during the peak-calling procedure. Nucleotide and dinucleotide compositions are computed and displayed in the form of heat maps and positional profiles
    2. PMSC3
    3. Motif Discovery: the workflow combines four word-based pattern-discovery algorithms that rely on two complementary criteria (overrepresentation and positional bias) to detect exceptional words (oligonucleotides) and spaced pairs of words (dyads). Significant words are used as seeds to build probabilistic description of motifs (position-specific scoring matrices), indicating residue variability at each position of the motif, represented as logos.
    4. PMSC3
    5. Motif comparisons: discovered motifs are compared with one or several public databases of annotated motifs to predict associated transcription factors. Results of this comparison are also displayed as multiple motif alignments (click on the link indicated in the red box) to highlight matches with several annotated motifs (e.g., factors belonging to the same family, composite motifs bound by protein complexes). Motif comparison is performed against vertebrate transcription factors binding motifs from JASPAR database.
    6. PMSC3 PMSC3
    7. Binding site predictions:Sequences are scanned with the discovered motifs to locate binding sites, and their positioning within peaks is analyzed (coverage, positional distribution along peaks).
    8. PMSC3

    To obtain a synthetic overview of the discovered motifs :

    1. at the top of the report, in the gray box, click on small summary
    2. PMSC3

    • Do we discover significant motifs ?
    • Are these motifs biologically relevant? In particular, did the program discover motifs related to ER or GATA3 ?

2 - Differential analysis

As we have two conditions (siGATA, siNT), we would like to find if some motifs are found in one dataset, but not the other. We are thus going to perform differential motif analysis.

  1. Use fetch-sequences to obtain the peak sequences for siNT (you should already have the peak sequences for siGATA condition). Save the two sequence files on your computer, since we will need to upload both of them separately for the next step.
  2. Run peak-motifs in differential analysis mode using siGATA (not treated) as Peak sequences and siNT as control sequences. Give as title : siGATA_vs_siNT_r3
  3. Do you obtain different motifs than with the single peak set analysis?
    Pre-calculated results are available here.
  4. The swap datasets (siNT as test, and siGATA as control) result is available here.
  5. Do you find motifs ? How do they compare with the previous ones ? Compare the swaped dataset (siNT as test, and siGATA as control) : does it make sense ?

2 - Negative controls

As in experimental biology, we perform negative controls for motif analyses. RSAT has multiple options to create datasets that can serve as controls. Here, we will use "random genome fragments", to select random regions of the same number and size as the siGATA peak set.

  1. In the left RSAT menu, click on build control sets and choose random genome fragments
  2. Use siGATA_vs_siNT_r3 FASTA sequence file as "template"
  3. Choose Local RSAT Organism => Homo Sapiens
  4. As output, choose FASTA sequences
  5. Click "GO" to run the program.
  6. Save the FASTA result on your machine
  7. PMSC3
  8. Run peak-motifs with this file as input, same options as above, title : random-genome fragments-siGATA_template.
  9. Do you expect to find significant motifs? Do you obtain significant motifs?
    Pre-calculated results are available here.

Visualizing the sites in the context of genome annotations

Goal: Visualize the predicted binding sites with the discovered motifs in genomic context.

1 - Load predicted binding sites into UCSC browser

Peak-motifs can prepare the BED files to be directly visualized in UCSC browser (or IGV !).

  1. At the bottom of the report, click on the UCSC icon in "Motif locations (sites)".
  2. This will open UCSC browser, and load the tracks of the peaks (coordinates only, not the shape) + one track per found motif.
  3. Search for the location
    chr7:75,680,888-75,681,629
    (located on chr7).
You should be able to see the location of the sites matching the discovered motifs within the peaks.
PMSC3