Plot mean expression profiles of each cluster from a ClusterSet object.
Source:R/plot_profiles.R
plot_profiles.RdThis function generates a barplot showing the expression profiles of cell type-specific genes across different cell types.
plot_profiles(
  data = NULL,
  ident = NULL,
  nb_column = NULL,
  color_cluster = NULL,
  size_text_y = 5,
  size_label = 2,
  legend_name = "Cell\ntype",
  to_lin = FALSE,
  averaged = FALSE
)
Arguments
- data
A ClusterSet object.
- ident
A named vector containing the cell type identities for each cell. Typically the result from the Idents() function on a Seurat object (see Seurat library).
- nb_column
The number of columns in the facet grid of the plot. If not provided, it is automatically computed as the square root of the number of cell types.
- color_cluster
A named vector of colors (with cell type as names) used to distinguish between different cell types in the plot. If not provided, the default hue color palette is used.
- size_text_y
The font size of the y-axis tick labels.
- size_label
The font size of the cluster labels.
- legend_name
A name for the legend.
- to_lin
Transform in linear scale (i.e. 2^x).
- averaged
Display the mean expression averaged across cells.
Value
A ggplot object showing the expression profiles of cell type-specific genes.
Examples
# Load a Seurat object
load_example_dataset("7870305/files/lymph_node_tiny_2")
#> |-- INFO : Dataset 7870305/files/lymph_node_tiny_2 was already loaded.
# Load a ClusterSet object
load_example_dataset("7870305/files/lymph_node_tiny_clusters_2")
#> |-- INFO : Dataset 7870305/files/lymph_node_tiny_clusters_2 was already loaded.
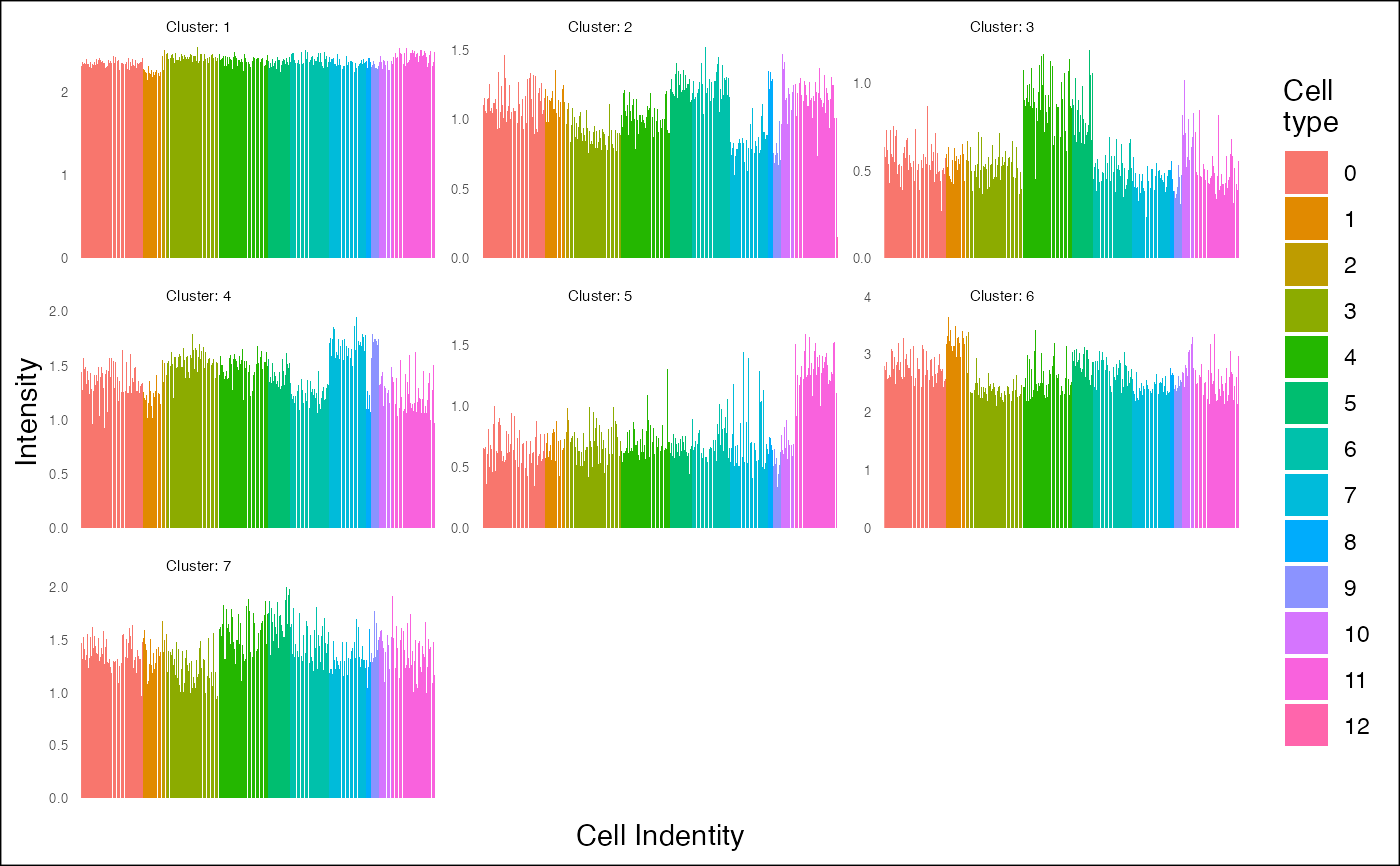
plot_profiles(lymph_node_tiny_clusters_2, ident=Seurat::Idents(lymph_node_tiny_2))
#> |-- INFO : Number of cells types: 13
#> |-- INFO : Number of cells: 442
 lv <- levels(Seurat::Idents(lymph_node_tiny_2))
pal <- discrete_palette(n=length(lv))
names(pal) <- lv
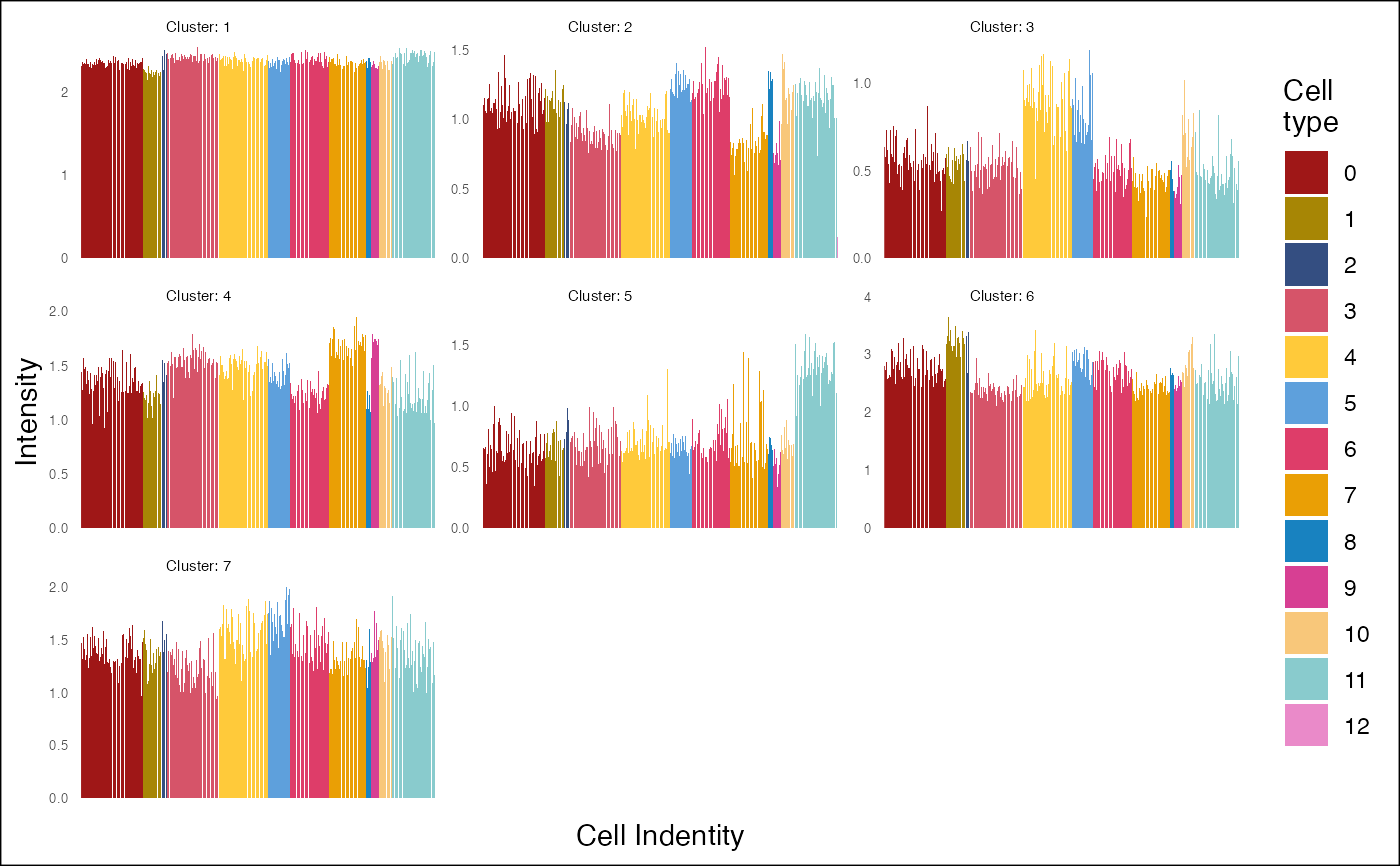
plot_profiles(lymph_node_tiny_clusters_2, ident=Seurat::Idents(lymph_node_tiny_2), color_cluster = pal)
#> |-- INFO : Number of cells types: 13
#> |-- INFO : Number of cells: 442
lv <- levels(Seurat::Idents(lymph_node_tiny_2))
pal <- discrete_palette(n=length(lv))
names(pal) <- lv
plot_profiles(lymph_node_tiny_clusters_2, ident=Seurat::Idents(lymph_node_tiny_2), color_cluster = pal)
#> |-- INFO : Number of cells types: 13
#> |-- INFO : Number of cells: 442
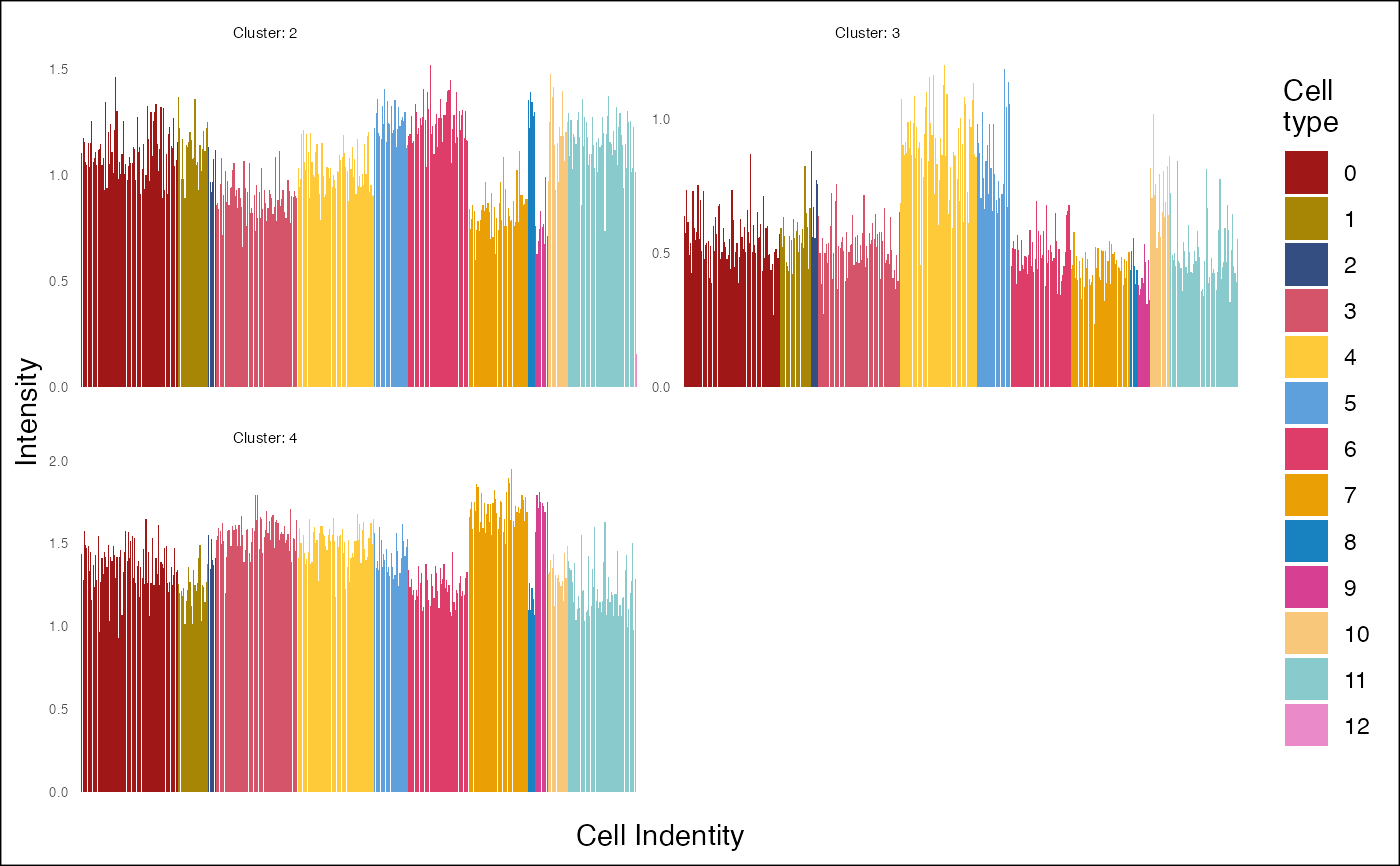
 plot_profiles(lymph_node_tiny_clusters_2[2:4,], ident=Seurat::Idents(lymph_node_tiny_2), color_cluster = pal)
#> |-- INFO : Number of cells types: 13
#> |-- INFO : Number of cells: 442
plot_profiles(lymph_node_tiny_clusters_2[2:4,], ident=Seurat::Idents(lymph_node_tiny_2), color_cluster = pal)
#> |-- INFO : Number of cells types: 13
#> |-- INFO : Number of cells: 442