Create a heatmap from a ClusterSet object.
plot_heatmap(
  object,
  center = TRUE,
  ceil = 1,
  floor = -1,
  cell_clusters = NULL,
  show_dendro = TRUE,
  use_top_genes = FALSE,
  interactive = TRUE,
  name = NULL,
  xlab = NULL,
  ylab = NULL,
  colorbar_name = "Exp. level",
  show_legend = TRUE,
  colors = colors_for_gradient("Ju1"),
  colors_cell_clusters = NULL,
  row_labels = TRUE,
  col_labels = FALSE,
  label_size = 10,
  line_size_vertical = 3,
  line_size_horizontal = 3,
  link = c("average", "complete", "single", "ward.D", "ward.D2", "mcquitty")
)
Arguments
- object
A ClusterSet object.
- center
A logical to indicate whether to center row.
- ceil
A value for ceiling (NULL for no ceiling). Ceiling is performed centering.
- floor
A value for flooring (NULL for no flooring). Flooring is performed after centering.
- cell_clusters
A vector of cell clusters with cell barcodes as names.
- show_dendro
A logical to indicate whether to show column dendrogram.
- use_top_genes
A logical to indicate whether to use highly similar genes in the slot top_genes of ClusterSet.
- interactive
A logical to indicate if the heatmap should be interactive.
- name
A title for the heatmap (if interactive is TRUE).
- xlab
A title for the x axis (if interactive is TRUE).
- ylab
A title for the y axis (if interactive is TRUE).
- colorbar_name
A title for the colorbar.
- show_legend
A logical to indicate whether to show colorbar.
- colors
A vector of colors.
- colors_cell_clusters
A named vector of colors for cell identity annotations.
- row_labels
A logical to indicate whether to show row labels.
- col_labels
A logical to indicate whether to show col labels.
- label_size
A value for label font size.
- line_size_vertical
An integer for the size of horizontal white line which separate gene clusters.
- line_size_horizontal
An integer for the size of vertical white line which separate cell clusters.
- link
The aggloremative criterion for hierarchical clustering. One of "average", "complete" or "single". Default to average.
Value
Iheatmap-class object.
Examples
library(Seurat)
# Set verbosity to 1 to display info messages only.
set_verbosity(1)
# Load datasets
load_example_dataset('7871581/files/pbmc3k_medium_clusters')
#> |-- INFO : Dataset 7871581/files/pbmc3k_medium_clusters was already loaded.
load_example_dataset('7871581/files/pbmc3k_medium')
#> |-- INFO : Dataset 7871581/files/pbmc3k_medium was already loaded.
# Plot heatmap of 'top genes' of all gene clusters
pbmc3k_medium_clusters <- top_genes(pbmc3k_medium_clusters)
#> |-- INFO : One or several clusters contain less than 20 genes. Retrieving all genes
#> |-- INFO : Extracting genes with the highest mean correlation to the others...
#> |-- INFO : Extracting genes with the highest mean correlation to the others...
#> |-- INFO : Extracting genes with the highest mean correlation to the others...
#> |-- INFO : Extracting genes with the highest mean correlation to the others...
#> |-- INFO : Extracting genes with the highest mean correlation to the others...
#> |-- INFO : Extracting genes with the highest mean correlation to the others...
#> |-- INFO : Extracting genes with the highest mean correlation to the others...
#> |-- INFO : Extracting genes with the highest mean correlation to the others...
#> |-- INFO : Extracting genes with the highest mean correlation to the others...
#> |-- INFO : Extracting genes with the highest mean correlation to the others...
#> |-- INFO : Extracting genes with the highest mean correlation to the others...
#> |-- INFO : Extracting genes with the highest mean correlation to the others...
#> |-- INFO : Extracting genes with the highest mean correlation to the others...
#> |-- INFO : Extracting genes with the highest mean correlation to the others...
#> |-- INFO : Extracting genes with the highest mean correlation to the others...
#> |-- INFO : Results are stored in 'top_genes' slot of the object.
plot_heatmap(pbmc3k_medium_clusters, use_top_genes=TRUE)
#> |-- INFO : cell_clusters is not NULL. Setting show_dendro to FALSE
#> |-- INFO : Centering matrix.
#> |-- INFO : Ceiling matrix.
#> |-- INFO : Flooring matrix.
#> |-- INFO : Ordering cells/columns using hierarchical clustering.
#> |-- INFO : Only top genes will be used.
#> |-- INFO : Plotting heatmap.
#> |-- INFO : Plot is interactive...
# Plot heatmap of gene cluster 1
plot_heatmap(pbmc3k_medium_clusters[1,])
#> |-- INFO : cell_clusters is not NULL. Setting show_dendro to FALSE
#> |-- INFO : Centering matrix.
#> |-- INFO : Ceiling matrix.
#> |-- INFO : Flooring matrix.
#> |-- INFO : Ordering cells/columns using hierarchical clustering.
#> |-- INFO : Plotting heatmap.
#> |-- INFO : Plot is interactive...
# Plot heatmap of gene cluster 1 and 3
plot_heatmap(pbmc3k_medium_clusters[c(1,3),])
#> |-- INFO : cell_clusters is not NULL. Setting show_dendro to FALSE
#> |-- INFO : Centering matrix.
#> |-- INFO : Ceiling matrix.
#> |-- INFO : Flooring matrix.
#> |-- INFO : Ordering cells/columns using hierarchical clustering.
#> |-- INFO : Plotting heatmap.
#> |-- INFO : Plot is interactive...
# Plot heatmap of 'top genes' of all gene clusters
# with cell ordered according to Seurat results
plot_heatmap(pbmc3k_medium_clusters, use_top_genes=TRUE, cell_clusters=Seurat::Idents(pbmc3k_medium))
#> |-- INFO : Extracting cell identity.
#> |-- INFO : Centering matrix.
#> |-- INFO : Ceiling matrix.
#> |-- INFO : Flooring matrix.
#> |-- INFO : Only top genes will be used.
#> |-- INFO : Plotting heatmap.
#> |-- INFO : Plot is interactive...
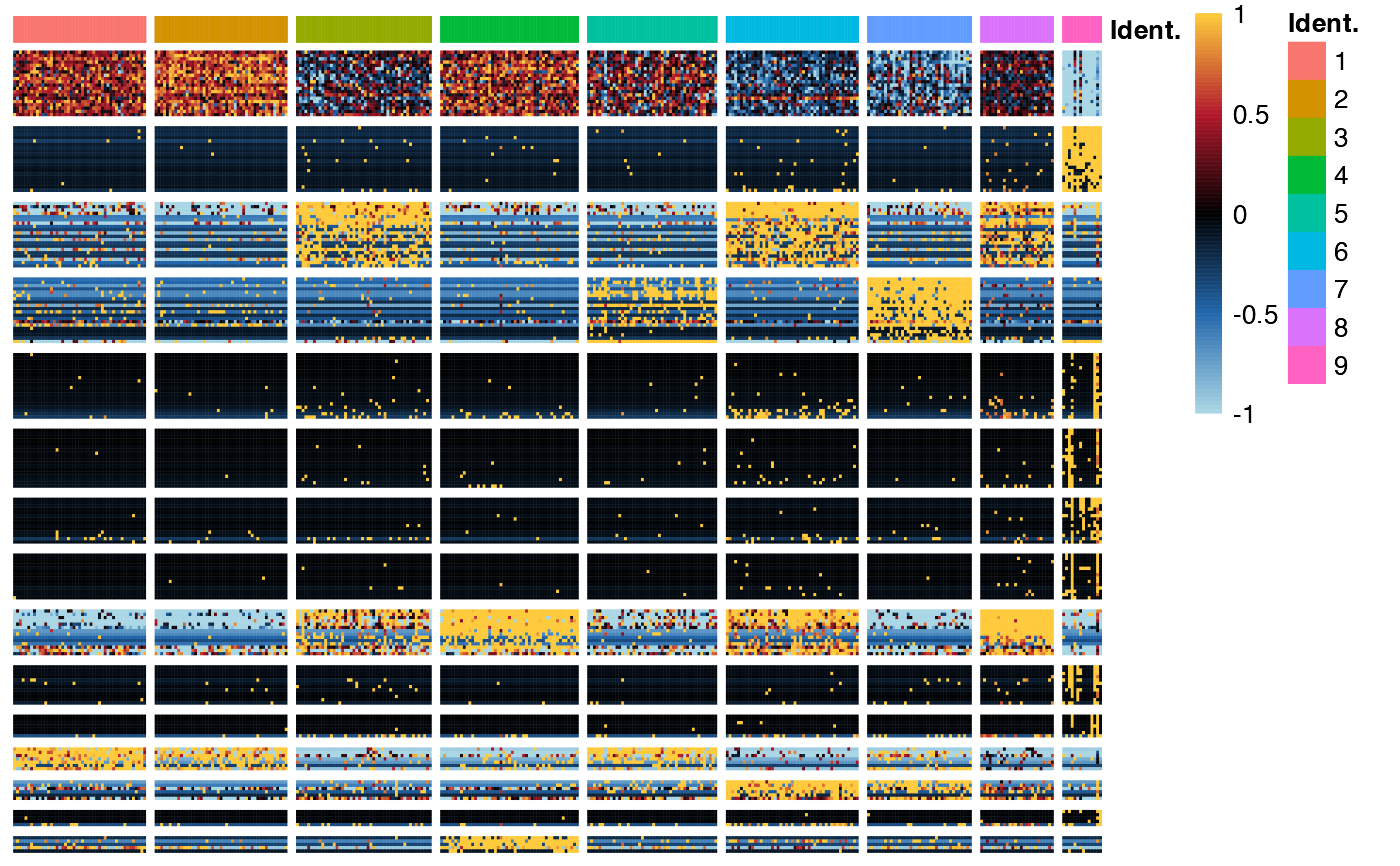
# Plot heatmap of 'top genes' of all gene clusters
# with cell ordered according to Seurat results
# (non interactive version)
plot_heatmap(pbmc3k_medium_clusters, use_top_genes=TRUE,
cell_clusters=Seurat::Idents(pbmc3k_medium),
interactive=FALSE, label_size = 2)
#> |-- INFO : Extracting cell identity.
#> |-- INFO : Centering matrix.
#> |-- INFO : Ceiling matrix.
#> |-- INFO : Flooring matrix.
#> |-- INFO : Only top genes will be used.
#> |-- INFO : Plotting heatmap.