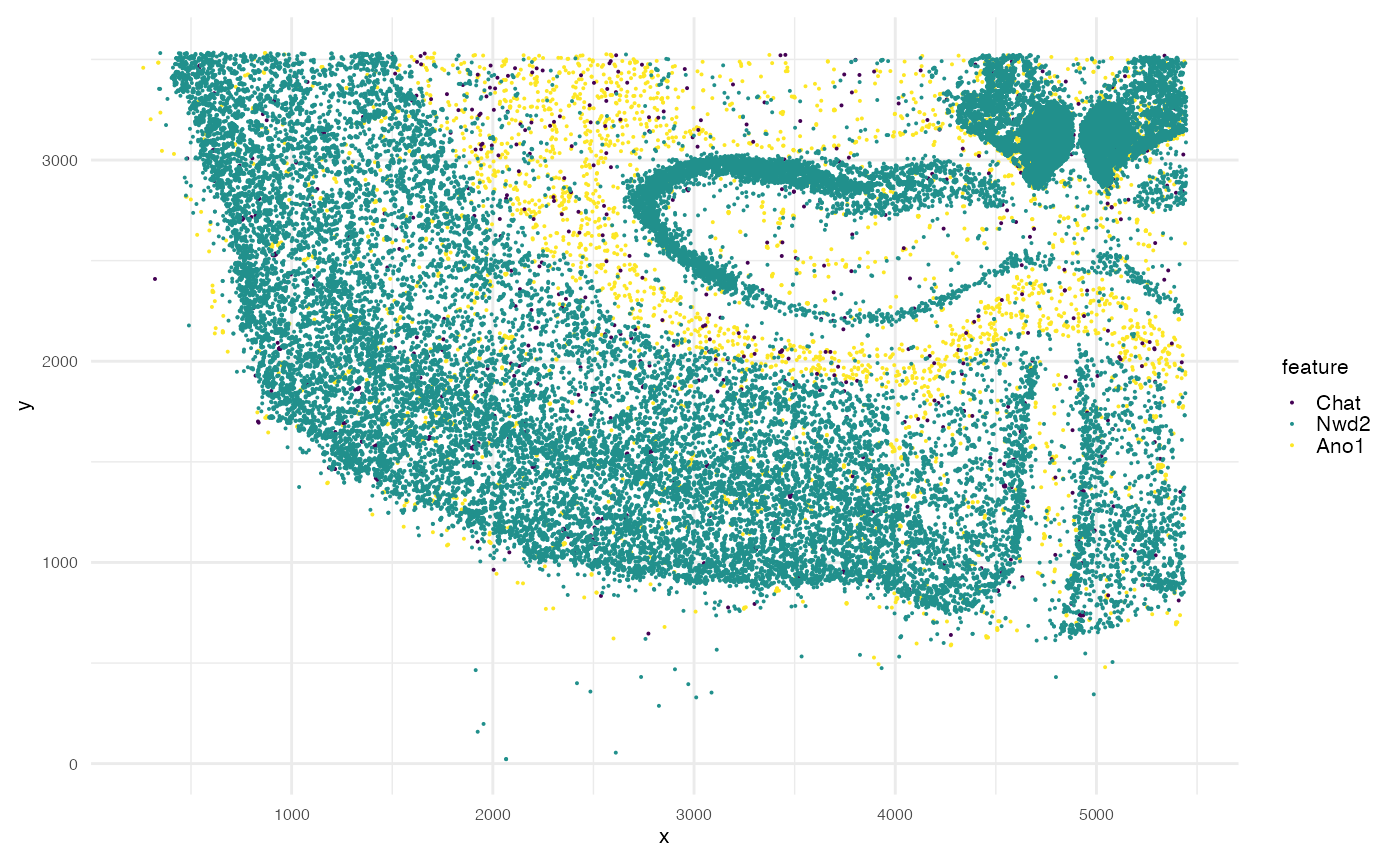
Plot x/y coordinates of molecules of a spatial transcriptomics experiment.
# S4 method for STGrid
spatial_plot(
  object = NULL,
  feat_list = NULL,
  colors = NULL,
  size = 0.1,
  coord_fixed = TRUE
)
Arguments
- object
The STGrid object.
- feat_list
The name of the features for which the spatial image will be created.
- colors
The colors to use for features in the spatial image.
- size
The size of the points
- coord_fixed
Logical value indicating whether to keep the aspect ratio fixed. Defaults to TRUE.
Examples
example_dataset()
xen <- Xenium_Mouse_Brain_Coronal_7g
spatial_plot(xen,
             feat_list=c("Chat", "Nwd2", "Ano1"),
             size=0.05)