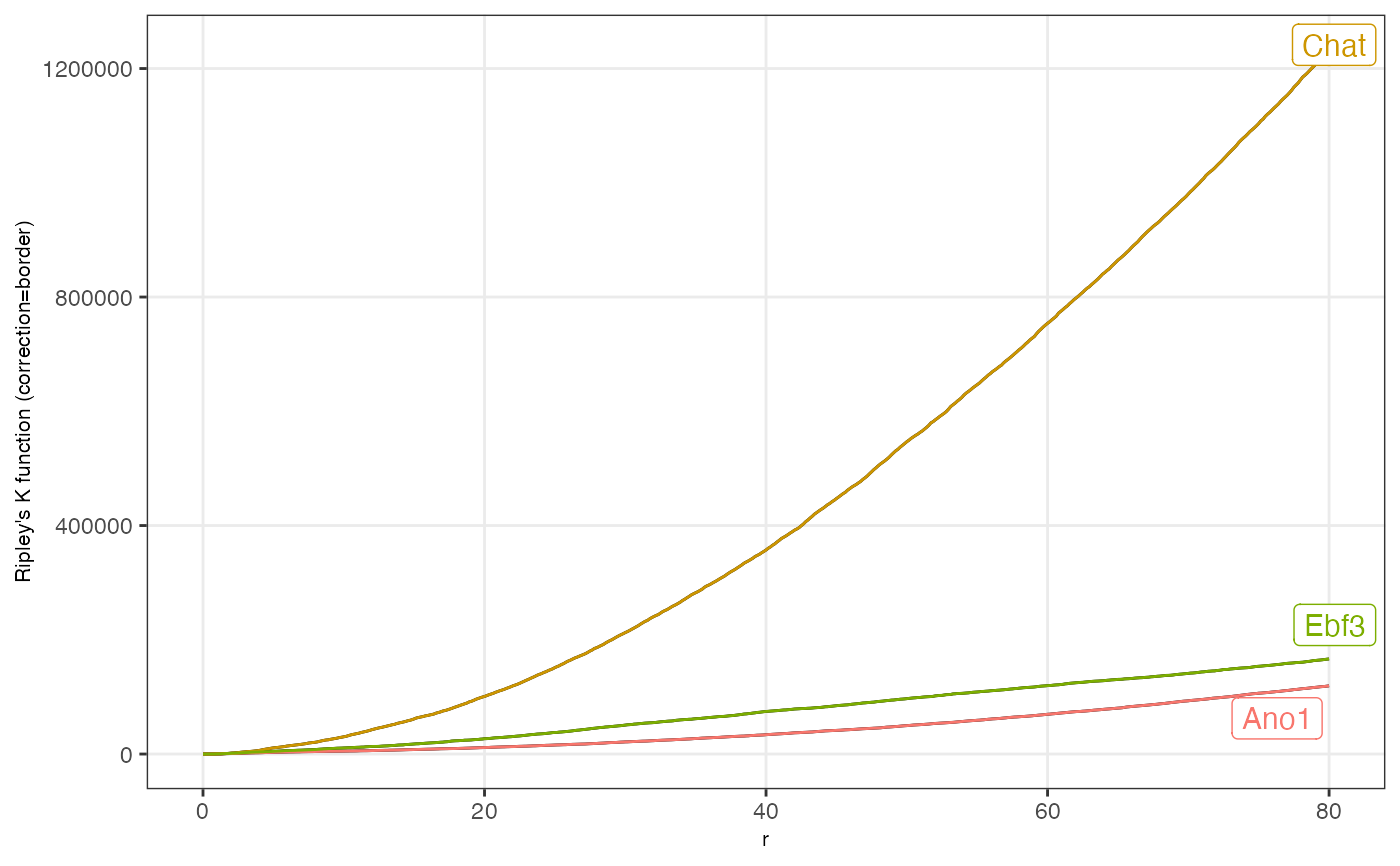
Call the Ripley's k function.
# S4 method for STGrid
plot_rip_k(
  object,
  correction = c("border", "isotropic", "Ripley", "translate"),
  max_feat_label = 8,
  color = NULL,
  size = 4
)
Arguments
- object
A STCompR object.
- correction
kind of correction should be displayed.
- max_feat_label
The maximum number of features to display. The features with the highest correction value (whatever the radius) are displayed.
- color
The colors for the features to be displayed.
- size
The size of the labels.
Examples
example_dataset()
#> |-- INFO :  Dataset 11284233/files/Xenium_Mouse_Brain_Coronal_7g was already loaded.
plot_rip_k(compute_k_ripley(Xenium_Mouse_Brain_Coronal_7g[c("Ano1", "Chat", "Ebf3")]))
#> |-- INFO :  >>> Estimating Ripley's reduced second moment function for all features.
#>
  |
  |                                                  |   0%
  |
  |=================                                 |  33%
  |
  |=================================                 |  67%
  |
  |==================================================| 100%