Compare distribution of features across various STGrid objects.
Source:R/visualization.R
dist_st.RdThis function compares distributions of features across various STGrid objects using different plot types, including histograms, density plots, boxplots, or boxjitter plots.
Arguments
- ...
One or more objects of class "STGrid" to be compared.
- normalized
Logical, indicating whether counts should be normalized. Defaults to FALSE.
- names
A character vector specifying the names for each object. Defaults to NULL, where default names are assigned.
- type
The type of plot to be generated. Can be one of "hist" (histogram), "density" (density plot), "boxplot", or "boxjitter". Defaults to "hist".
- transform
The transformation to be applied to the counts. Can be one of "None", "log2", "log10", or "log". Defaults to "None".
- border_color
The color of the border for plot elements. Defaults to "#333333".
- fill_color
A character vector specifying the fill colors for the plot. If NULL, default palette is used. Defaults to NULL.
- ncol
Number of columns for facet wrap. Defaults to 2.
Examples
example_dataset()
#> |-- INFO : Dataset 11284233/files/Xenium_Mouse_Brain_Coronal_7g was already loaded.
xen <- Xenium_Mouse_Brain_Coronal_7g
x_bins <- bin_x(xen)[180:nbin_x(xen)]
y_bins <- bin_y(xen)[100:nbin_y(xen)]
xen_r1 <- xen[x_bins, y_bins]
x_bins <- bin_x(xen)[60:100]
y_bins <- bin_y(xen)[100:nbin_y(xen)]
xen_r2 <- xen[x_bins, y_bins]
x_bins <- bin_x(xen)[20:60]
y_bins <- bin_y(xen)[20:60]
xen_r3 <- xen[x_bins, y_bins]
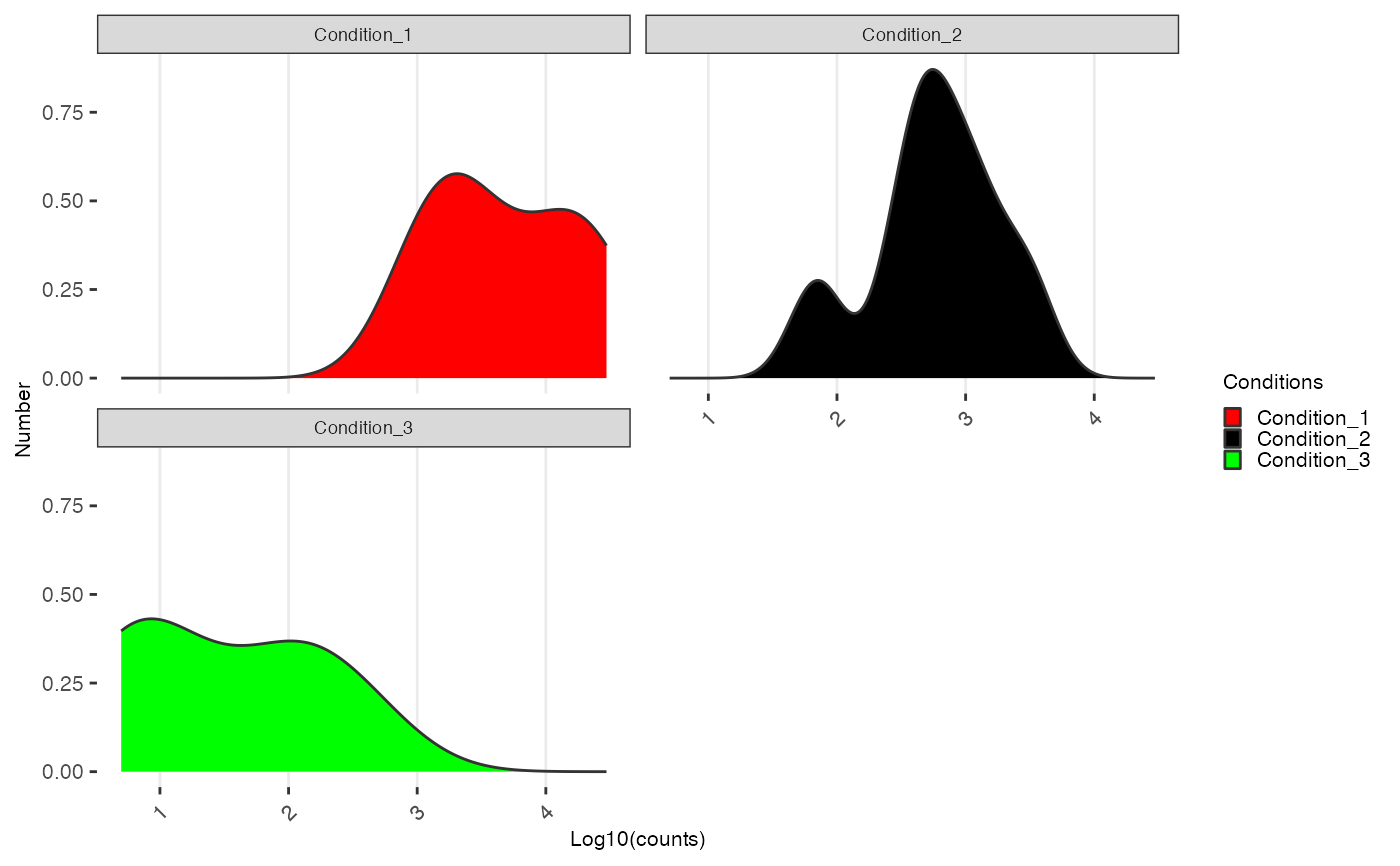
dist_st(xen_r1, xen_r2, xen_r3,
fill_color=c("red", "black", "green"),
type="density",
transform="log10")
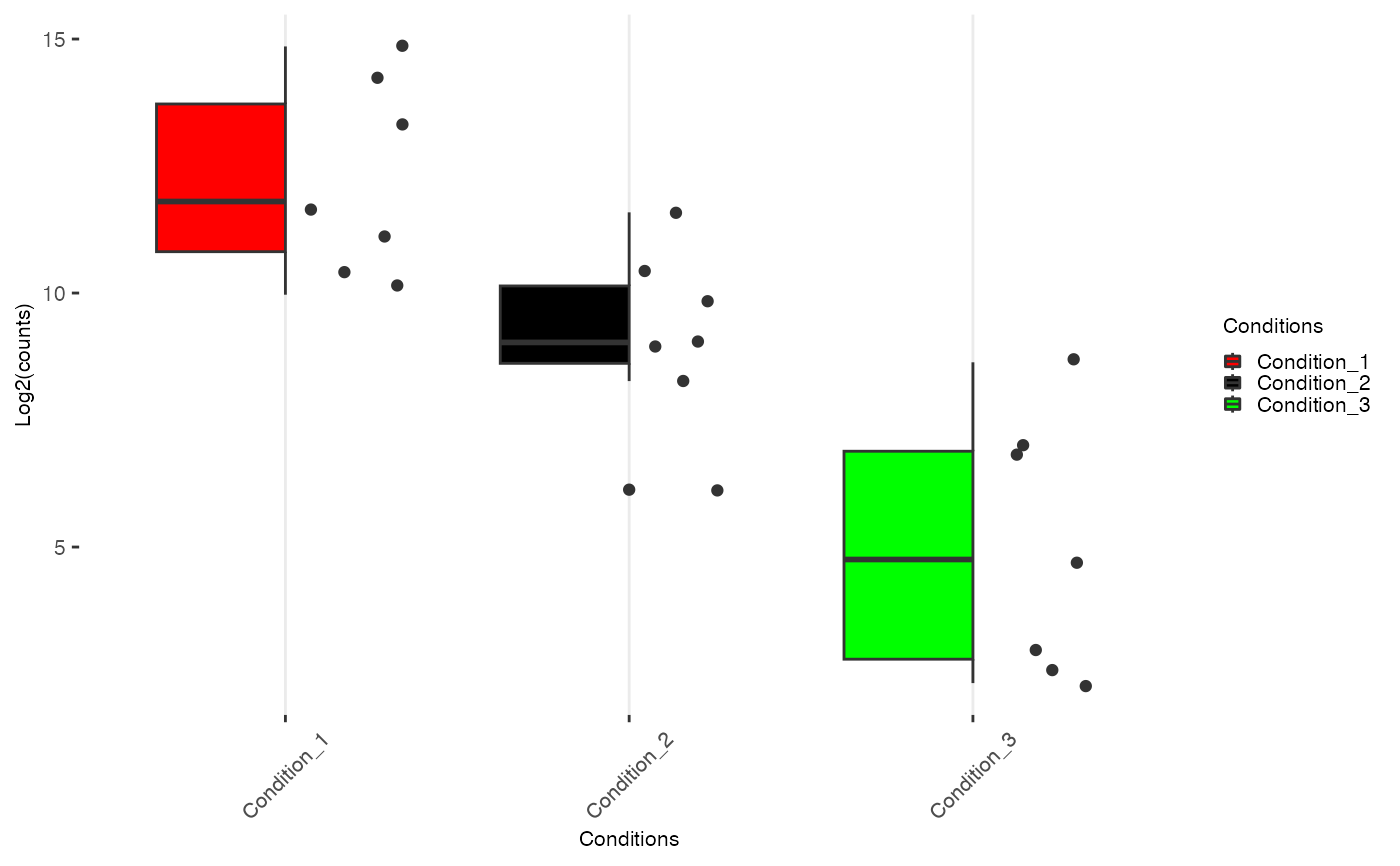
 dist_st(xen_r1, xen_r2, xen_r3,
fill_color=c("red", "black", "green"),
type="boxjitter",
transform="log2")
dist_st(xen_r1, xen_r2, xen_r3,
fill_color=c("red", "black", "green"),
type="boxjitter",
transform="log2")