Create a Hull around a Feature component of an STGrid
Source:R/visualization.R
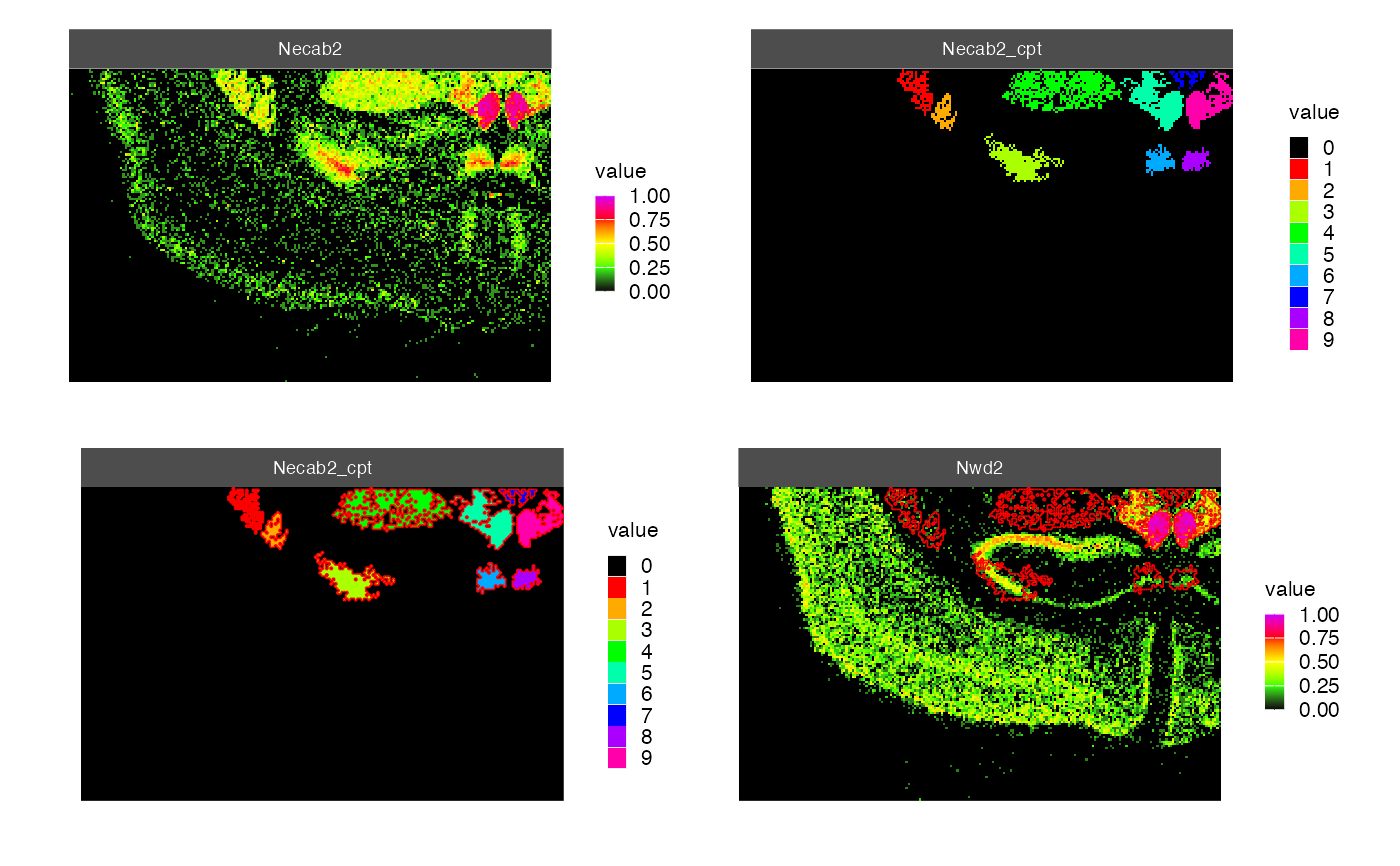
create_hull-STGrid-method.RdThe component of a binarized feature can be produced by the connected_components() function. This function creates a hull around these components.
# S4 method for STGrid
create_hull(object = NULL, feature = NULL, color = "white", linewidth = 0.5)
Arguments
- object
An STGrid object containing the spatial expression data.
- feature
A character string specifying the meta feature of interest. Only one feature should be provided.
- color
A character string specifying the color of the hull lines. Default is "white".
- linewidth
A numeric value specifying the width of the hull lines. Default is 0.5.
Value
A list of ggplot2 geom_segment objects representing the convex hull. This elements can be added to a ggplot object as produced by spatial_image().
Details
The function first checks if the specified meta feature exists in the STGrid object and whether it is numeric and integer. It then generates a binary matrix representing the feature's presence, constructs horizontal and vertical segments for the hull, and returns these segments as ggplot2 geom_segment objects.
Examples
library(patchwork)
example_dataset()
#> |-- INFO :  Dataset 11284233/files/Xenium_Mouse_Brain_Coronal_7g was already loaded.
xen <- Xenium_Mouse_Brain_Coronal_7g
p1 <- spatial_image(xen, feat="Necab2")
xen <- connected_components(xen, feat_list = "Necab2", threshold = 5, min_size = 30)
head(meta(xen))
#>                               count_sum Necab2_cpt
#> [1.01e+03,1.03e+03)~[22,47)           0          0
#> [1.01e+03,1.03e+03)~[47,72)           0          0
#> [1.01e+03,1.03e+03)~[72,97)           0          0
#> [1.01e+03,1.03e+03)~[97,122)          0          0
#> [1.01e+03,1.03e+03)~[122,147)         0          0
#> [1.01e+03,1.03e+03)~[147,172)         0          0
p2 <- spatial_image(xen, feat="Necab2_cpt",  as_factor=TRUE, colors = c("black", rainbow(9)))
hull <- create_hull(xen, feat="Necab2_cpt", color="red", linew=0.3)
#> |-- INFO :  Creating segments
p3 <- p2 + hull
p4 <- spatial_image(xen, feat="Nwd2") + hull
(p1 | p2 ) / (p3 | p4)