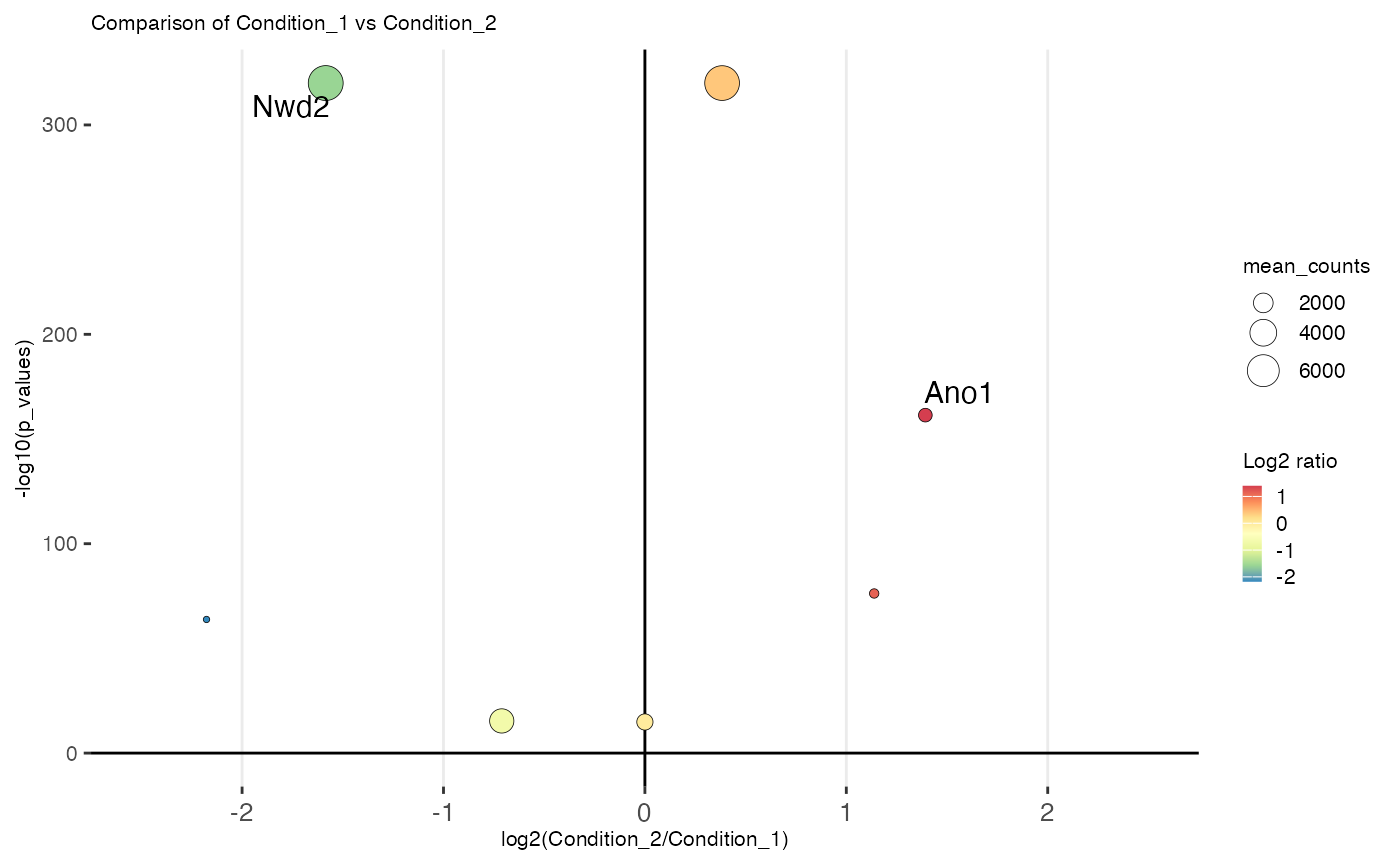
Create a volcano plot to compare molecule counts between 2 conditions.
Source:R/visualization.R
cmp_volcano.RdCreate a boxplot/jitter plot to show molecule counts distribution.
cmp_volcano(
  object,
  y_axis = c("p_values", "padj"),
  x_lim = c(-2.5, 2.5),
  colors = rev(RColorBrewer::brewer.pal(7, "Spectral")),
  text_y_lim = 100,
  text_x_lim = 1,
  text_size = 4,
  title = NULL,
  max.overlaps = 10
)
Arguments
- object
A STCompR object.
- y_axis
Character vector specifying the y-axis variable. Options are "p_values" or "padj".
- x_lim
Numeric vector specifying the x-axis limits. Default is c(-2.5, 2.5).
- colors
Color palette for the plot. Default is RColorBrewer::brewer.pal(7, "Spectral").
- text_y_lim
Numeric value specifying the threshold for feature labels on the y-axis. Genes with -log10(p-value) less than this threshold will not be labeled. Default is 100.
- text_x_lim
Numeric value specifying the threshold for feature labels on the x-axis. Genes with absolute x-values less than this threshold will not be labeled. Default is 2.
- text_size
Numeric value specifying the size of text labels in the plot. Default is 5.
- title
A title for the diagram.
- max.overlaps
The maximum number of label overlaps.
Examples
example_dataset("11284296/files/cmp_xen")
#> |-- INFO :  Dataset 11284296/files/cmp_xen was already loaded.
cmp_xen
#> |-- INFO :  An object of class STCompR
#> |-- INFO :  xen_r1 Condition_1
#> |-- INFO :  xen_r2 Condition_2
#> |-- INFO :  Number of features:  7
#> |-- INFO :  >>> Please, use show_st_methods(class = 'STCompR') to show availables methods <<<
cmp_volcano(cmp_xen)