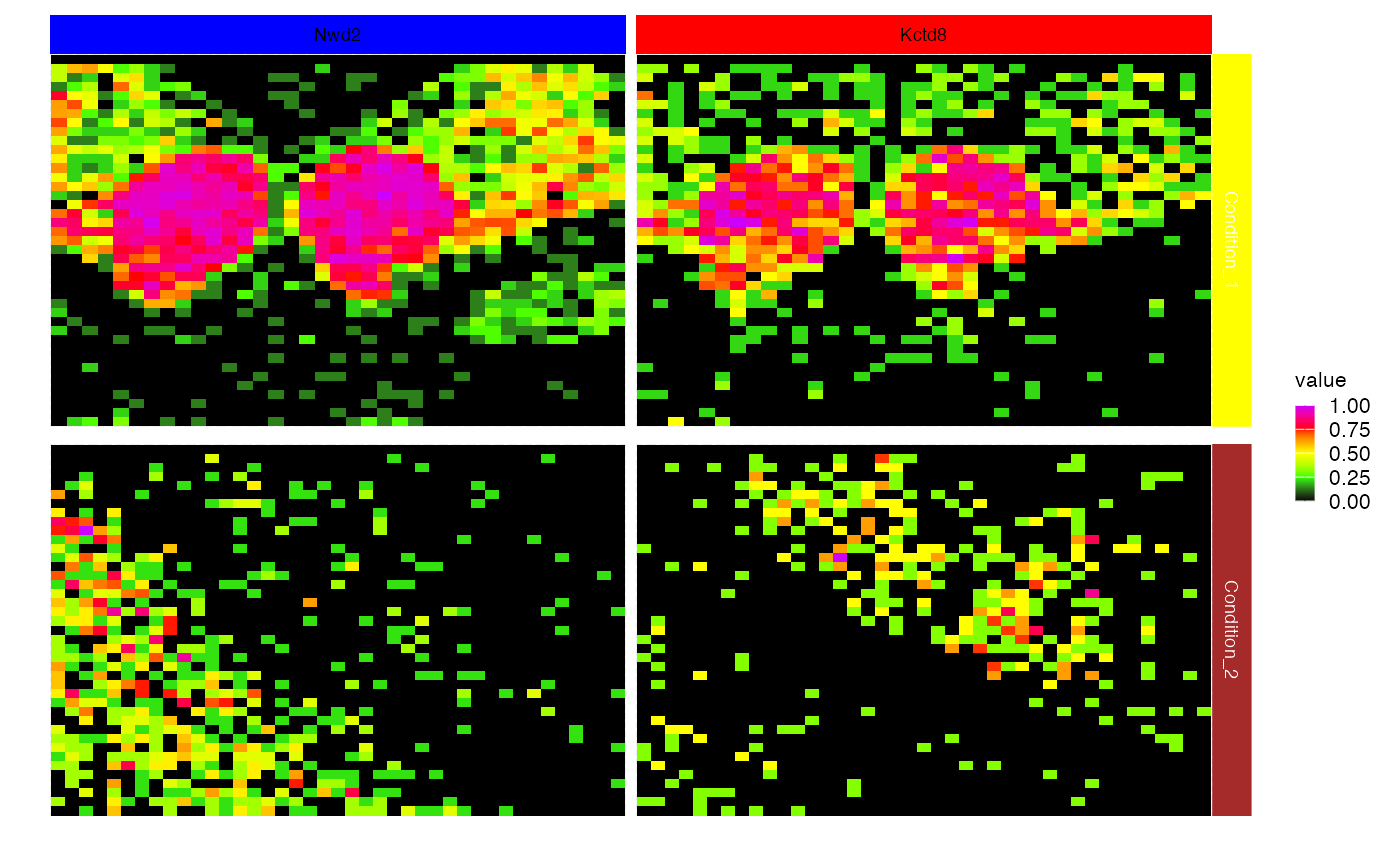
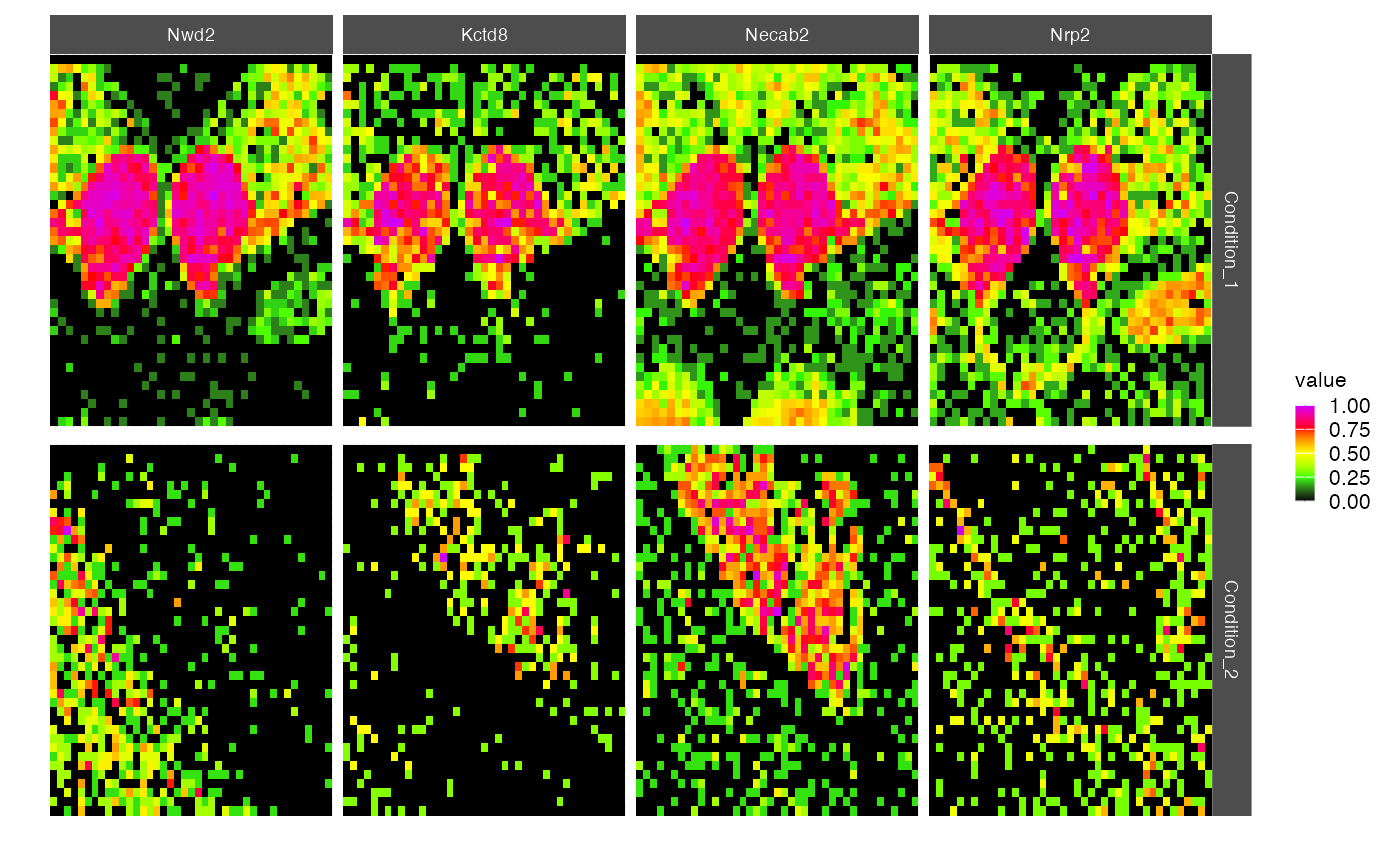
This function compares and visualizes multiple spatial images obtained from STGrid objects. It displays a color-coded representation of the feature (e.g., molecules) density observed in spatial transcriptomics experiments for different conditions.
cmp_images(
  ...,
  feat_list = NULL,
  names = NULL,
  colors = c("black", "#33FF00", "#FFFF00", "#FF0000", "#CC00FF"),
  saturation = 1,
  coord_fixed = TRUE,
  scale = TRUE,
  logb = 10,
  color_x_strip = NULL,
  color_y_strip = NULL,
  color_strip_text_x = "white",
  color_strip_text_y = "white",
  pseudo_count = 1,
  condition_vs_feat = TRUE
)
Arguments
- ...
STGrid objects to be compared.
- feat_list
A list of features for which the spatial images will be created.
- names
Names for the conditions or experiments. Defaults to NULL.
- colors
The colors to use for gradient fill in the spatial images. Defaults to viridis::inferno(10).
- saturation
The ceiling level for the feature expression values. Defaults to 1 (no ceiling).
- coord_fixed
Logical value indicating whether to keep the aspect ratio fixed. Defaults to TRUE.
- scale
Logical value indicating whether to scale the feature expression values. Defaults to TRUE.
- logb
The basis for the log transformation. Default to 10. If NULL, no log transformation.
- color_x_strip
Strip colors (x axis). If not Null must also set color_y_strip.
- color_y_strip
Strip colors (y axis). If not Null must also set color_x_strip.
- color_strip_text_x
Strip text colors (x axis).
- color_strip_text_y
Strip text colors (y axis).
- pseudo_count
A value for the pseudo count used for log transformation (default to 1).
- condition_vs_feat
Logical indicating whether to facet by condition vs. feature (TRUE) or by feature vs. condition (FALSE). Defaults to TRUE.
Examples
example_dataset()
#> |-- INFO : Dataset 11284233/files/Xenium_Mouse_Brain_Coronal_7g was already loaded.
xen <- Xenium_Mouse_Brain_Coronal_7g
x_bins <- bin_x(xen)[181:nbin_x(xen)]
y_bins <- bin_y(xen)[101:nbin_y(xen)]
xen_1 <- xen[x_bins, y_bins]
x_bins <- bin_x(xen)[61:101]
y_bins <- bin_y(xen)[101:nbin_y(xen)]
xen_2 <- xen[x_bins, y_bins]
cmp_images(xen_1, xen_2, feat_list = c("Nwd2", "Kctd8", "Necab2", "Nrp2"))
 cmp_images(xen_1, xen_2, feat_list = c("Nwd2", "Kctd8"), color_x_strip=c("blue", "red"),
color_y_strip=c("yellow", "brown"), color_strip_text_x="black", color_strip_text_y="white")
#> |-- INFO : Strip colors were provided.
#> |-- INFO : Preparing colored strips.
cmp_images(xen_1, xen_2, feat_list = c("Nwd2", "Kctd8"), color_x_strip=c("blue", "red"),
color_y_strip=c("yellow", "brown"), color_strip_text_x="black", color_strip_text_y="white")
#> |-- INFO : Strip colors were provided.
#> |-- INFO : Preparing colored strips.