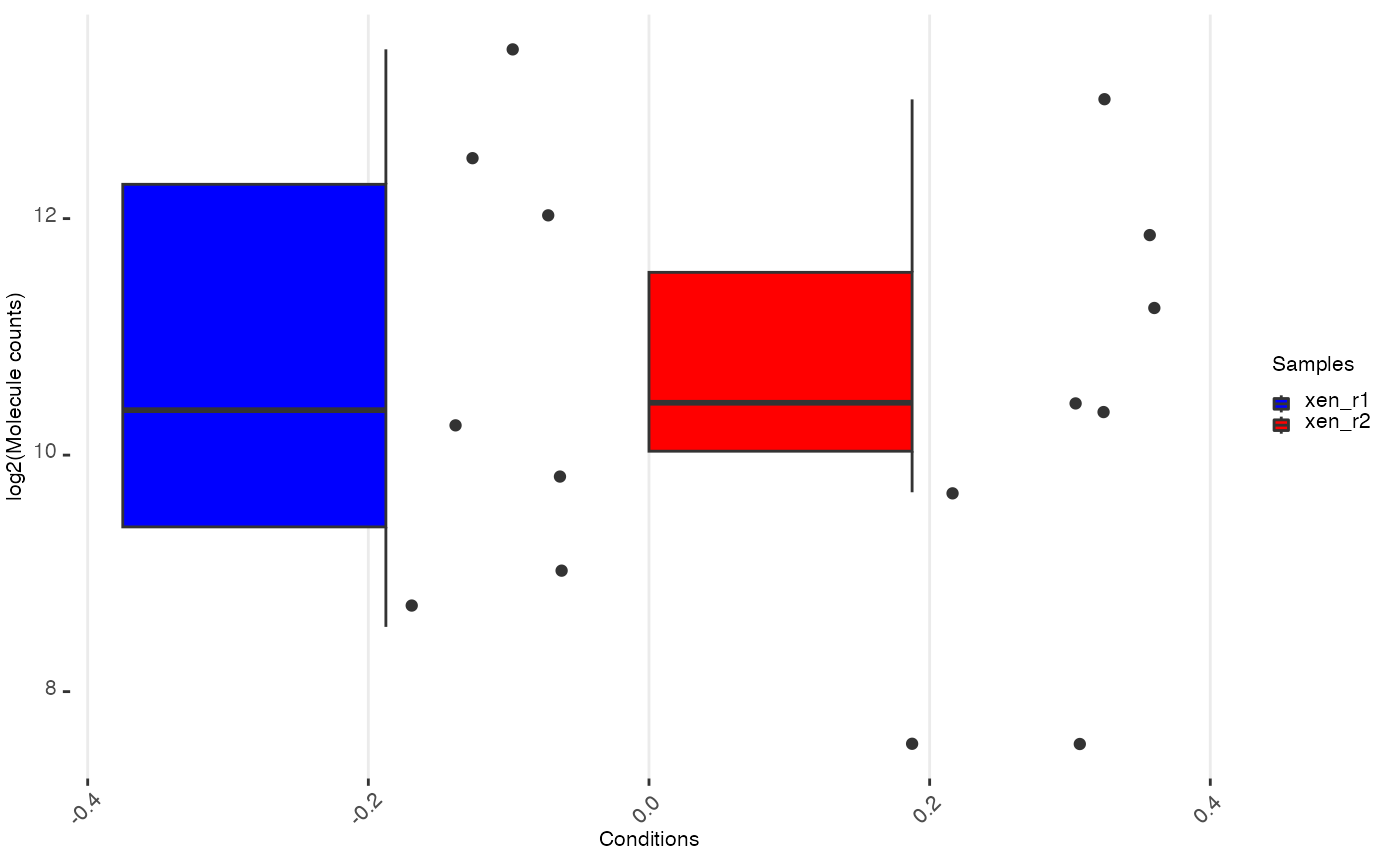
Create a boxplot/jitter plot to show molecule counts distribution.
Source:R/visualization.R
cmp_boxplot.RdCreate a boxplot/jitter plot to show molecule counts distribution.
Arguments
- object
A STCompR object.
- normalized
A logical value indicating whether to use normalized counts.
- transform
A character string specifying the transformation to be applied to molecule counts. Options include "None", "log2", "log10", and "log".
- colors
A vector of colors for the boxplot/jitter plot.
- ...
Additional arguments to be passed to the underlying ggpol::geom_boxjitter function.
Value
A ggplot object displaying the molecule counts distribution.
Examples
example_dataset("11284296/files/cmp_xen")
#> |-- INFO :  Dataset 11284296/files/cmp_xen was already loaded.
cmp_xen
#> |-- INFO :  An object of class STCompR
#> |-- INFO :  xen_r1 Condition_1
#> |-- INFO :  xen_r2 Condition_2
#> |-- INFO :  Number of features:  7
#> |-- INFO :  >>> Please, use show_st_methods(class = 'STCompR') to show availables methods <<<
cmp_boxplot(cmp_xen, normalized = TRUE, transform = "log2", colors = c("blue", "red"))