Commands from section ‘coverage’
In this section we will require the following datasets:
$ gtftk get_example -q -d mini_real -f '*'
$ gtftk get_example -q -d mini_real_noov_rnd_tx -f '*'
coverage
Description: Takes a GTF as input to compute bigwig coverage in regions of interest (promoter, transcript body, intron, intron_by_tx, tts…) or a BED6 to focus on user-defined regions. If –n-highest is used the program will compute the coverage of each bigwig based on the average value of the n windows (–nb-window) with the highest coverage values. Regions were signal can be computed (if GTF file as input) are promoter, tts, introns, intergenic regions or any feature available in the GTF file (transcript, exon, gene…). If –matrix-out is selected, the signal for each bigwig will be provided in a dedicated column. Otherwise, signal for each bigwig is provided through a dedicated line.
Warning
The coverage example below use 8 CPUs. Please adapt.
We will compute coverage of promoters regions using 3 bigWig files as input.
$ gtftk coverage -l H3K4me3,H3K79me2,H3K36me3 -u 5000 -d 5000 -i mini_real_noov_rnd_tx.gtf.gz -c hg38 -m transcript_id,gene_name -x ENCFF742FDS_H3K4me3_K562_sub.bw ENCFF947DVY_H3K79me2_K562_sub.bw ENCFF431HAA_H3K36me3_K562_sub.bw -k 8 > coverage.bed
Now we can have a look at the result:
$ head -n 10 coverage.bed
chrom	start	end	name	strand	H3K4me3	H3K79me2	H3K36me3
chr1	996137	1006138	ENST00000624697|ISG15	+	5.859314	4.0025	1.632737
chr1	1370156	1380157	ENST00000338370|AURKAIP1	-	25.746325	12.173583	3.20328
chr1	1914257	1924258	ENST00000378598|TMEM52	-	5.927807	2.4218580000000003	1.374963
chr1	2202732	2212733	ENST00000469733|FAAP20	-	1.0	1.0	1.0
chr1	2493646	2503647	ENST00000462379|PLCH2	+	1.227377	1.062994	1.068393
chr1	3064167	3074168	ENST00000511072|PRDM16	+	1.0	1.0	1.0
chr1	3630449	3640450	ENST00000469643|WRAP73	-	1.0	1.0	1.0
chr1	6414902	6424903	ENST00000377836|HES2	-	1.951105	1.682232	1.439256
chr1	9178749	9188750	ENST00000437157|MIR34AHG	-	1.331067	1.272973	1.436956
Arguments:
$ gtftk coverage -h
  Usage: gtftk coverage [-i GTF/BED] [-o TXT] -c CHROMINFO [-u UPSTREAM] [-d DOWNSTREAM] [-w nb_window] [-k nb_proc] [-f ft_type] [-l labels] [-m name_column] [-p pseudo_count] [-n n_highest] [-x] [-zn] [-a key_name] [-s {mean,sum}] [-h] [-V [verbosity]] [-D] [-C] [-K tmp_dir] [-A] [-L logger_file] [-W write_message_to_file] bw_list [bw_list ...]

  Description:

     Takes a GTF as input to compute bigwig coverage in regions of interest (promoter, transcript body,
     intron, intron_by_tx, tts...) or a BED6 to focus on user-defined regions. If --n-highest is
     used the program will compute the coverage of each bigwig based on the average value of the n
     windows (--nb-window) with the highest coverage values.

  Notes:
     *  chrom-info may also accept 'mm8', 'mm9', 'mm10', 'hg19', 'hg38', 'rn3' or 'rn4'. In this
     case the  corresponding size of conventional chromosomes are used. To get the size of  the
     chromosome in ensembl format (whithout chr prefix), use 'mm8_ens', 'mm9_ens',  'mm10_ens',
     'hg19_ens', 'hg38_ens', 'rn3_ens' or 'rn4_ens'. ChrM is not used.
     *  Regions were signal can be computed (if GTF file as input): promoter/tss, tts, introns,
     intron_by_tx, intergenic regions or any feature available in the GTF file (transcript, exon,
     gene...).
     *  If --matrix-out is selected, the signal for each bigwig will be provided in a dedicated
     column. Otherwise, signal for each bigwig is provided through a dedicated line.
     *  If bed is used as input, each region should have its own name (column 4).

Arguments:
 bw_list                      A list of Bigwig file (last argument).
 -i, --inputfile              The input GTF/BED file. Only GTF file if <stdin> is used. (default: <stdin>)
 -o, --outputfile             Output file. (default: <stdout>)
 -c, --chrom-info             Tabulated two-columns file. Chromosomes as column 1 and sizes as column 2 (default: None)
 -u, --upstream               Extend the regions in 5' by a given value (int). (default: 0)
 -d, --downstream             Extend the regions in 3' by a given value (int). (default: 0)
 -w, --nb-window              Split the region into w bins (see -n). (default: 1)
 -k, --nb-proc                Use this many threads to compute coverage. (default: 1)
 -f, --ft-type                Region in which coverage is to be computed (promoter, intron, intergenic, tts or any feature defined in the column 3 of the GTF). (default: promoter)
 -l, --labels                 Bigwig labels. (default: None)
 -m, --name-column            Use this ids to compute the name (4th column in bed output). (default: transcript_id)
 -p, --pseudo-count           A pseudo-count to add in case count is equal to 0. (default: 1)
 -n, --n-highest              For each bigwig, use the n windows with higher values to compute coverage. (default: None)
 -x, --matrix-out             Matrix output format. Bigwigs as column names and features as rows. (default: False)
 -zn, --zero-to-na            Use NA not zero when region is undefined in bigwig or below window size. (default: False)
 -a, --key-name               If gtf format is requested, the name of the key. (default: cov)
 -s, --stat                   The statistics to be computed for each region. (default: mean)

Command-wise optional arguments:
 -h, --help                   Show this help message and exit.
 -V, --verbosity              Set output verbosity ([0-3]). (default: 0)
 -D, --no-date                Do not add date to output file names. (default: False)
 -C, --add-chr                Add 'chr' to chromosome names before printing output. (default: False)
 -K, --tmp-dir                Keep all temporary files into this folder. (default: None)
 -A, --keep-all               Try to keep all temporary files even if process does not terminate normally. (default: False)
 -L, --logger-file            Stores the arguments passed to the command into a file. (default: None)
 -W, --write-message-to-file  Store all message into a file. (default: None)
mk_matrix
Description: Gtftk implements commands that can be used to produce coverage profiles around genomic features or inside user-defined regions. A coverage matrix needs first to be produced from a bwig using the mk_matrix command.
Example:
We will used the same dataset (mini_real.gtf) as produced above (see help on coverage command).
We can now create a coverage matrix around TSS/TTS or along the full transcript (with or without 5’ and 3’ regions). Provide a BED file as —inputfile if you want to use your own, user-specific, regions. Will will create tree example datasets:
First we will create a coverage matrix around promoter based on a subset of randomly choose transcripts (one per gene) from the ‘mini_real’ dataset (see section on the coverage command to get info about the construction of the mini_real_noov_rnd_tx.gtf.gz dataset).
Warning
The mk_matrix example below use 8 CPUs. Please adapt.
$ gtftk mk_matrix -k 8 -i mini_real_noov_rnd_tx.gtf.gz -d 5000 -u 5000 -w 200 -c hg38 -l H3K4me3,H3K79me,H3K36me3 -y ENCFF742FDS_H3K4me3_K562_sub.bw ENCFF947DVY_H3K79me2_K562_sub.bw ENCFF431HAA_H3K36me3_K562_sub.bw -o mini_real_promoter
The following command computes coverage profil along the whole transcript.
$ gtftk mk_matrix -k 8 --bin-around-frac 0.5 -i mini_real_noov_rnd_tx.gtf.gz -t transcript  -d 5000 -u 5000 -w 200 -c hg38  -l  H3K4me3,H3K79me,H3K36me3 -y ENCFF742FDS_H3K4me3_K562_sub.bw ENCFF947DVY_H3K79me2_K562_sub.bw ENCFF431HAA_H3K36me3_K562_sub.bw -o mini_real_tx
 |-- 10:50-WARNING-mk_matrix : Encountered regions shorter than bin number.
 |-- 10:50-WARNING-mk_matrix : ENST00000385018 has length : 82
 |-- 10:50-WARNING-mk_matrix : They will be set to NA or --pseudo-count depending on --zero-to-na.
 |-- 10:50-WARNING-mk_matrix : Filter them out please.
 |-- 10:50-WARNING-mk_matrix : Encountered regions shorter than bin number.
 |-- 10:50-WARNING-mk_matrix : ENST00000583764 has length : 85
 |-- 10:50-WARNING-mk_matrix : They will be set to NA or --pseudo-count depending on --zero-to-na.
 |-- 10:50-WARNING-mk_matrix : Filter them out please.
 |-- 10:50-WARNING-mk_matrix : Encountered regions shorter than bin number.
 |-- 10:50-WARNING-mk_matrix : ENST00000612829 has length : 85
 |-- 10:50-WARNING-mk_matrix : They will be set to NA or --pseudo-count depending on --zero-to-na.
 |-- 10:50-WARNING-mk_matrix : Filter them out please.
 |-- 10:50-WARNING-mk_matrix : Encountered regions shorter than bin number.
 |-- 10:50-WARNING-mk_matrix : ENST00000637495 has length : 68
 |-- 10:50-WARNING-mk_matrix : They will be set to NA or --pseudo-count depending on --zero-to-na.
 |-- 10:50-WARNING-mk_matrix : Filter them out please.
/Users/puthier/anaconda3/envs/pygtftk_py3.9_dev/lib/python3.9/site-packages/pygtftk-1.6.2-py3.9-macosx-10.9-x86_64.egg/pygtftk/plugins/mk_matrix.py:503: FutureWarning: In a future version of pandas all arguments of DataFrame.drop except for the argument 'labels' will be keyword-only.
  df_up = df_up.drop(['start', 'end'], 1)
/Users/puthier/anaconda3/envs/pygtftk_py3.9_dev/lib/python3.9/site-packages/pygtftk-1.6.2-py3.9-macosx-10.9-x86_64.egg/pygtftk/plugins/mk_matrix.py:516: FutureWarning: In a future version of pandas all arguments of DataFrame.drop except for the argument 'labels' will be keyword-only.
  df_dws = df_dws.drop(['start', 'end'], 1)
$ gtftk mk_matrix -h
  Usage: gtftk mk_matrix [-i GTF/BED] -y bigwiglist [bigwiglist ...] -o GTF/TXT [-l labels] [-t {promoter,tts,transcript,user_regions,single_nuc}] [-p pseudo_count] [-u upstream] [-d downstream] -c chrom_info [-w bin_nb] [-k nb_proc] [-b bin_around_frac] [-zn] [-nst] [-h] [-V [verbosity]] [-D] [-C] [-K tmp_dir] [-A] [-L logger_file] [-W write_message_to_file]

  Description:

     Create a matrix storing the bigwig coverage computed from binned regions.

  Notes:
     *  chrom-info may also accept 'mm8', 'mm9', 'mm10', 'hg19', 'hg38', 'rn3' or 'rn4'. In this
     case the  corresponding size of conventional chromosomes are used. To get the size of  the
     chromosome in ensembl format (whithout chr prefix), use 'mm8_ens', 'mm9_ens',  'mm10_ens',
     'hg19_ens', 'hg38_ens', 'rn3_ens' or 'rn4_ens'. ChrM is not used.

Arguments:
 -i, --inputfile              A GTF file or bed file. A GTF if <stdin>. (default: <stdin>)
 -y, --bigwiglist             A list of Bigwig files (last argument). (default: None)
 -o, --outputfile             Output file name (.zip extension will be added). (default: <stdout>)
 -l, --labels                 Bigwig labels (i.e short name version for plotting). (default: None)
 -t, --ft-type                If input is a GTF, the region to analyse. (default: promoter)
 -p, --pseudo-count           Pseudo-count to add to all values. (default: 0)
 -u, --upstream               Extend the region of interest in 5' by a given value. (default: 1000)
 -d, --downstream             Extend the region of interest in 3' by a given value. (default: 1000)
 -c, --chrom-info             Tabulated file (chr as column 1, sizes as column 2.) (default: None)
 -w, --bin-nb                 Split the region into w bins. (default: 100)
 -k, --nb-proc                Use this many threads to compute coverage. (default: 1)
 -b, --bin-around-frac        Fraction of bins used in 5' and 3' regions. (default: 0.1)
 -zn, --zero-to-na            Use NA not zero when region is undefined in bigwig. (default: False)
 -nst, --no-stranded          The bins should not be oriented relative to strand. (default: False)

Command-wise optional arguments:
 -h, --help                   Show this help message and exit.
 -V, --verbosity              Set output verbosity ([0-3]). (default: 0)
 -D, --no-date                Do not add date to output file names. (default: False)
 -C, --add-chr                Add 'chr' to chromosome names before printing output. (default: False)
 -K, --tmp-dir                Keep all temporary files into this folder. (default: None)
 -A, --keep-all               Try to keep all temporary files even if process does not terminate normally. (default: False)
 -L, --logger-file            Stores the arguments passed to the command into a file. (default: None)
 -W, --write-message-to-file  Store all message into a file. (default: None)
profile
Description: This command is used to create profil diagrams from a mk_matrix output. The two important arguments for this command are —group-by, that defines the variable controling the set of colored lines and —facet-var that defines the variable controling the way the plot is facetted. Both —group-by and —facet-var should be set to one of bwig, tx_classes or chrom.
Basic profiles
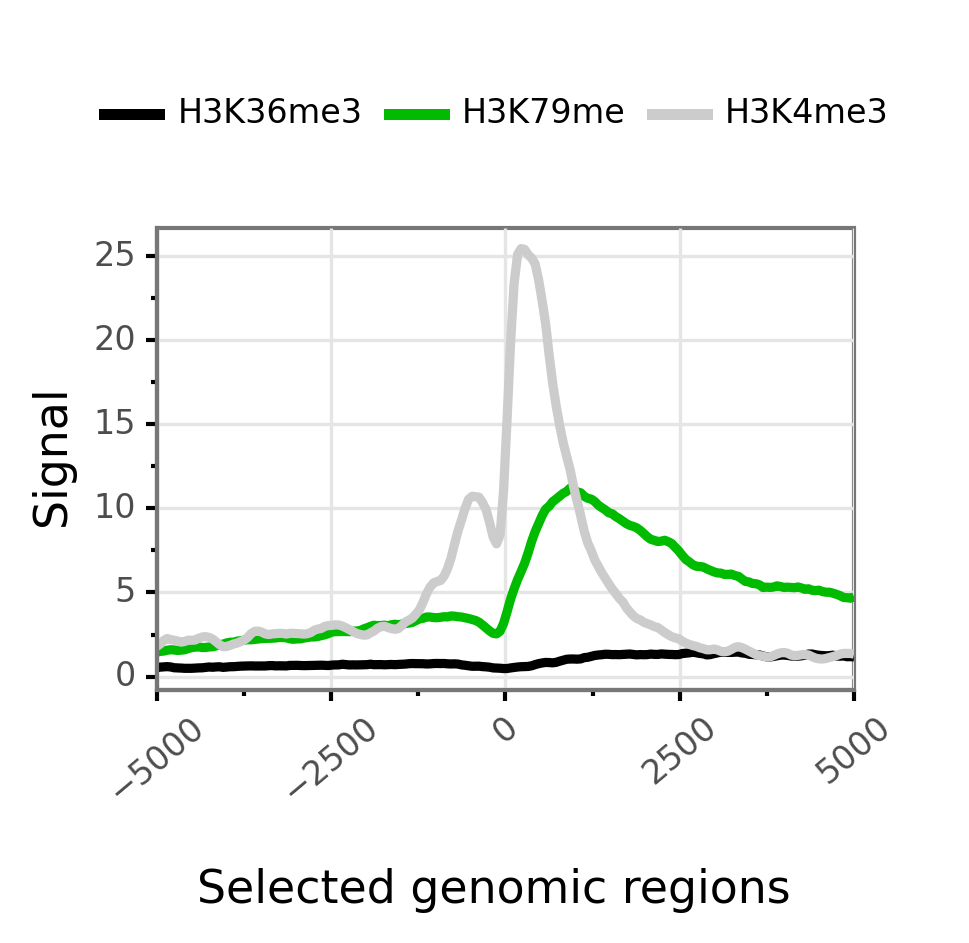
A simple overlayed profile of all epigenetic marks around promoter. Here —group-by is, by default set to bwig and —facet-var is set to None. Thus a single plot with several lines corresponding to bwig coverage is obtained.
$ gtftk profile -D -i mini_real_promoter.zip -o profile_prom -pf png -if  example_01.png
 |-- 10:50-WARNING-profile : --group-by not set. Choosing 'bwig'.
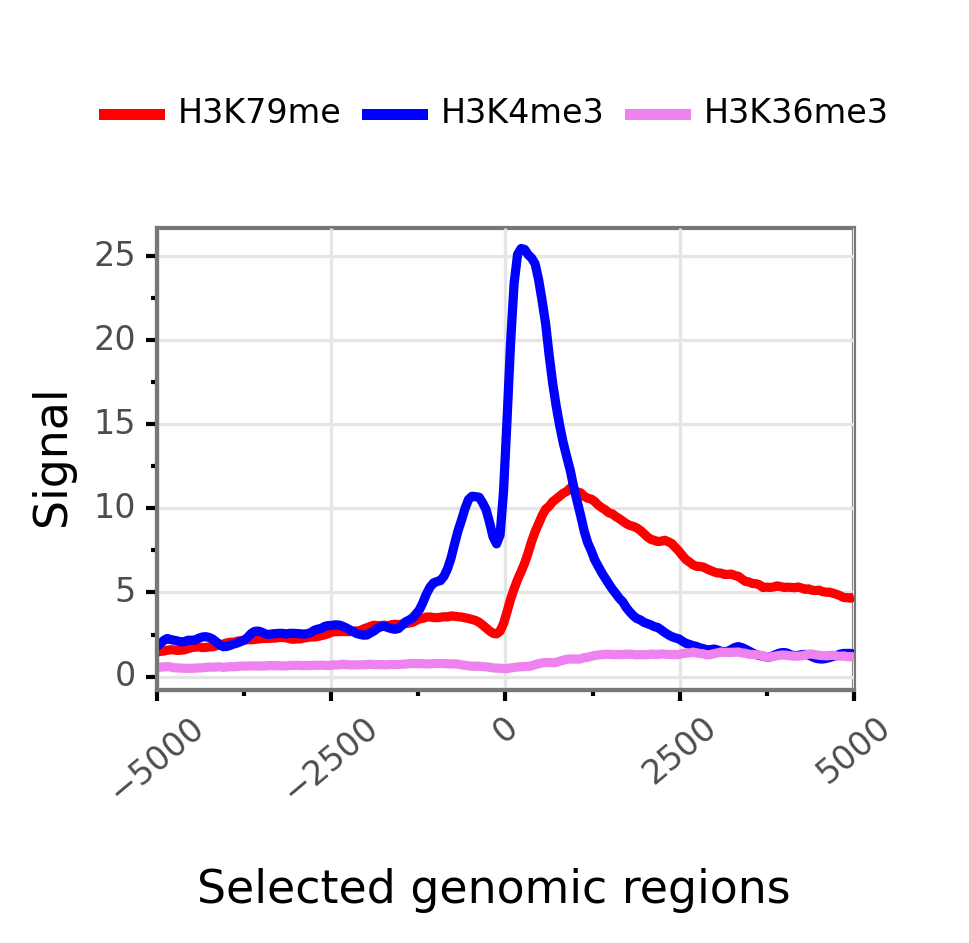
Changing colors and applying color order can be done using the following syntax:
$ gtftk profile -D -i mini_real_promoter.zip -c 'red,blue,violet' -d H3K79me,H3K4me3,H3K36me3 -o profile_prom -pf png -if  example_01b.png
 |-- 10:50-WARNING-profile : --group-by not set. Choosing 'bwig'.
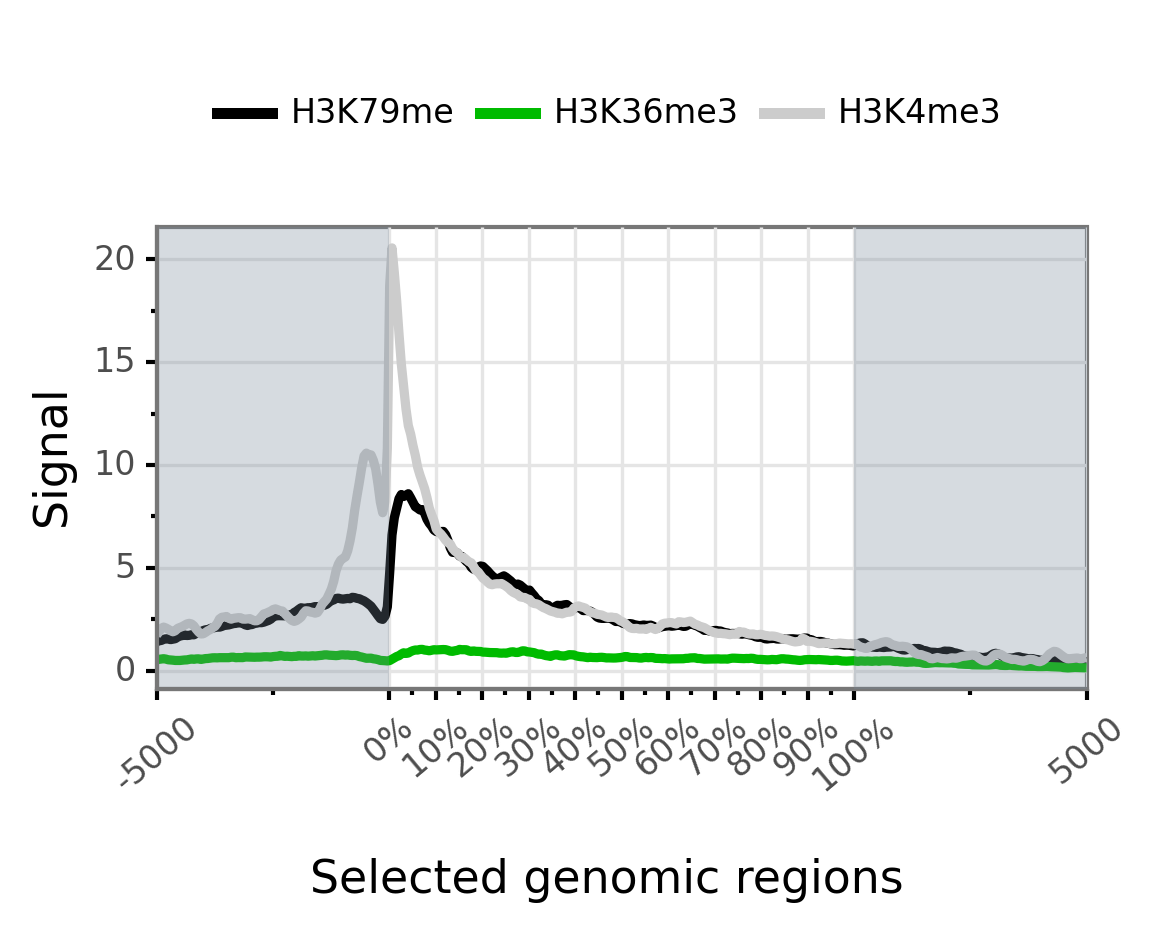
Transcript coverage is obtained using the mini_real_tx.zip matrix. This provides a simple overlayed profile of all epigenetic marks along the transcript body extended in 5’ and 3’ regions:
$ gtftk profile -D -i mini_real_tx.zip -o profile_tx -pf png -if  example_02.png
 |-- 10:50-WARNING-profile : --group-by not set. Choosing 'bwig'.
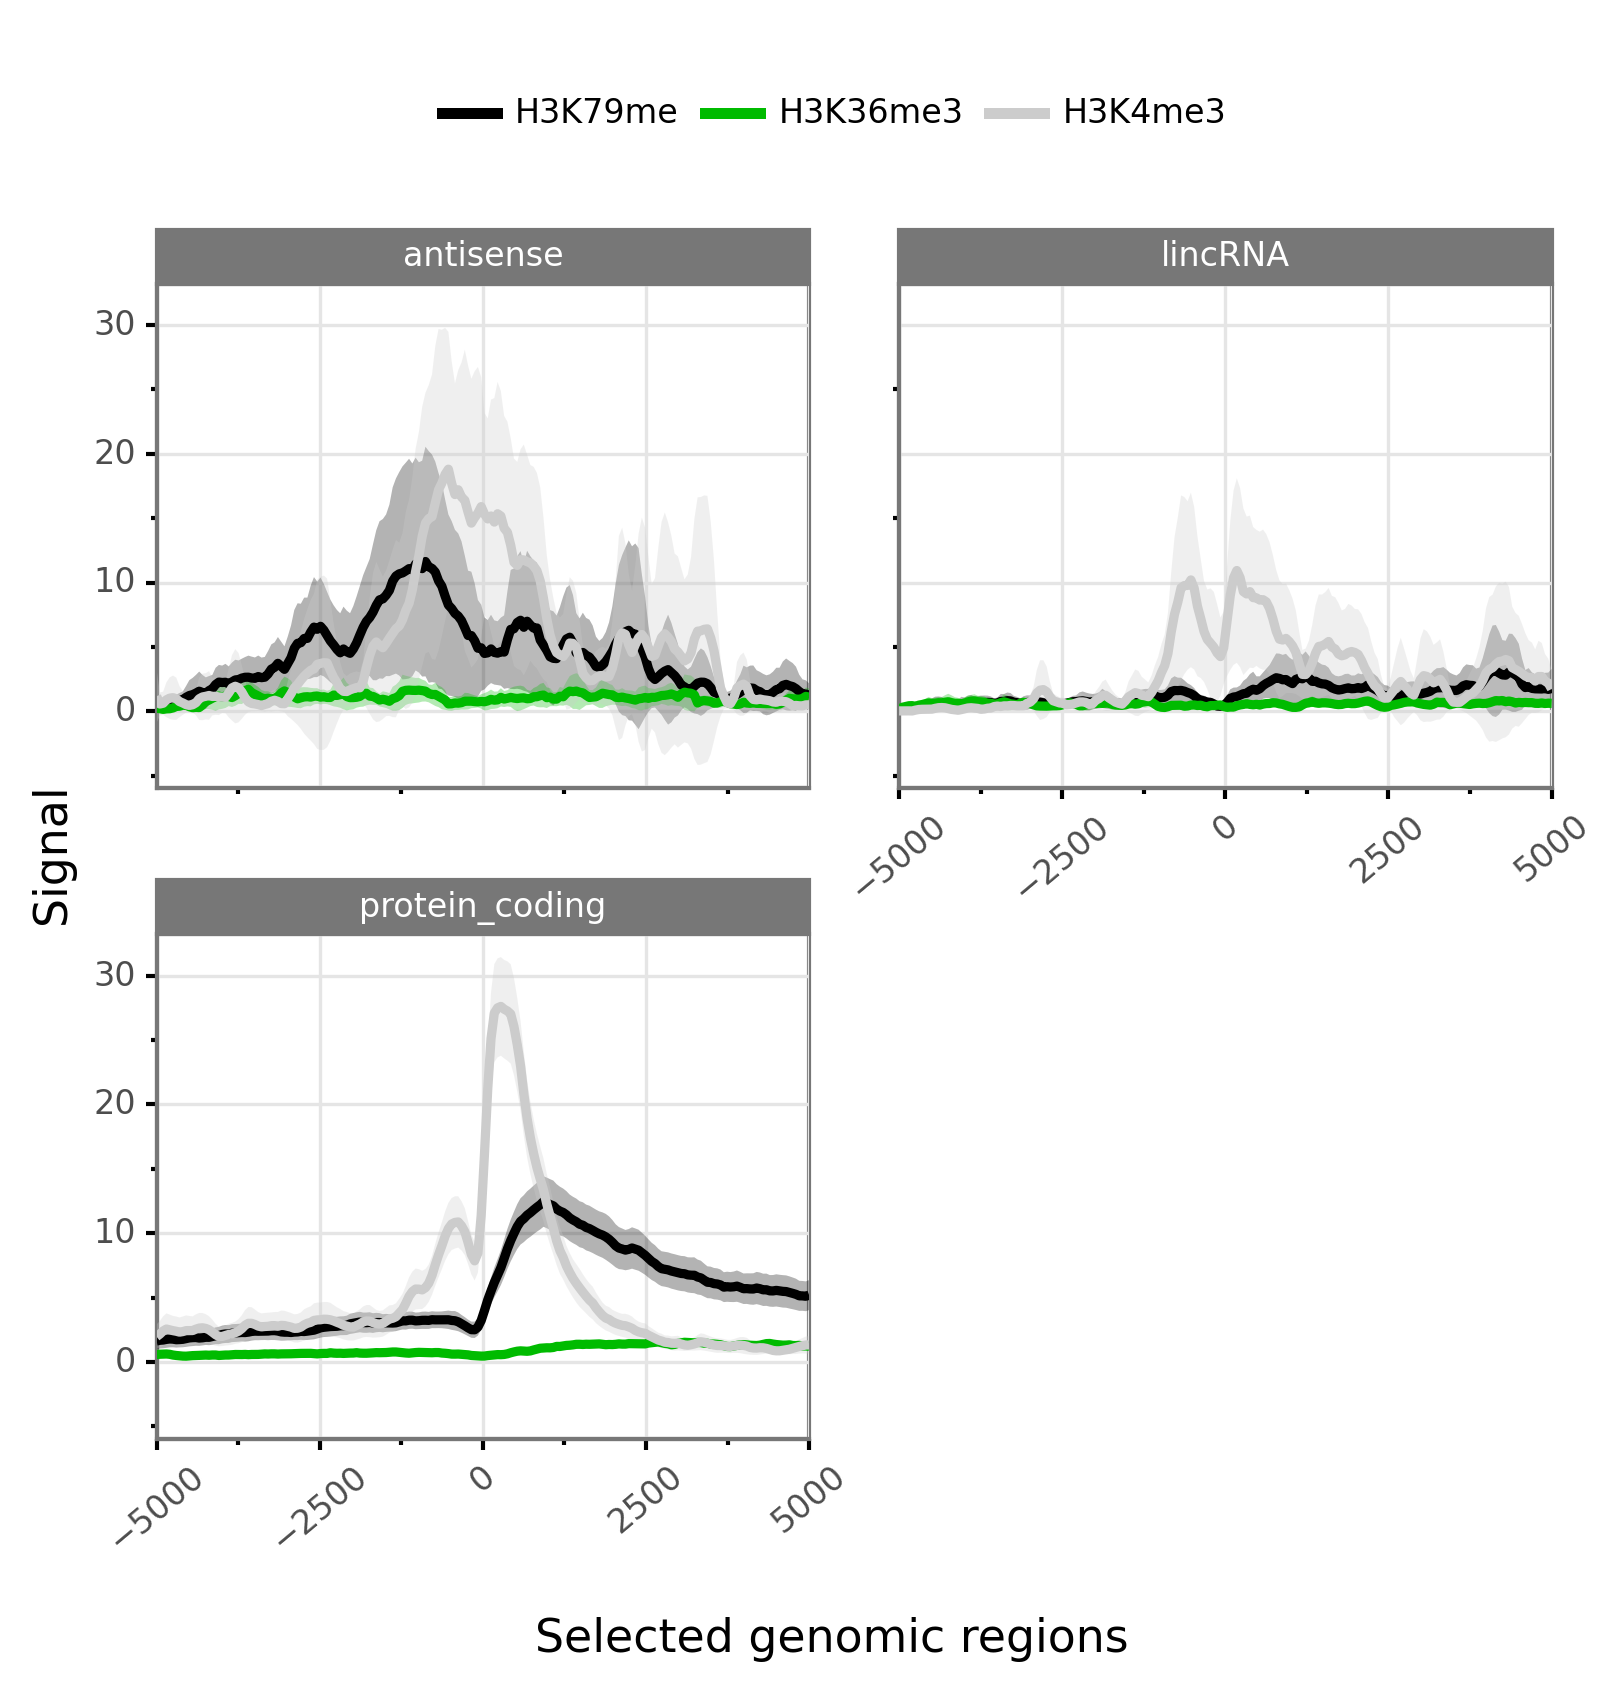
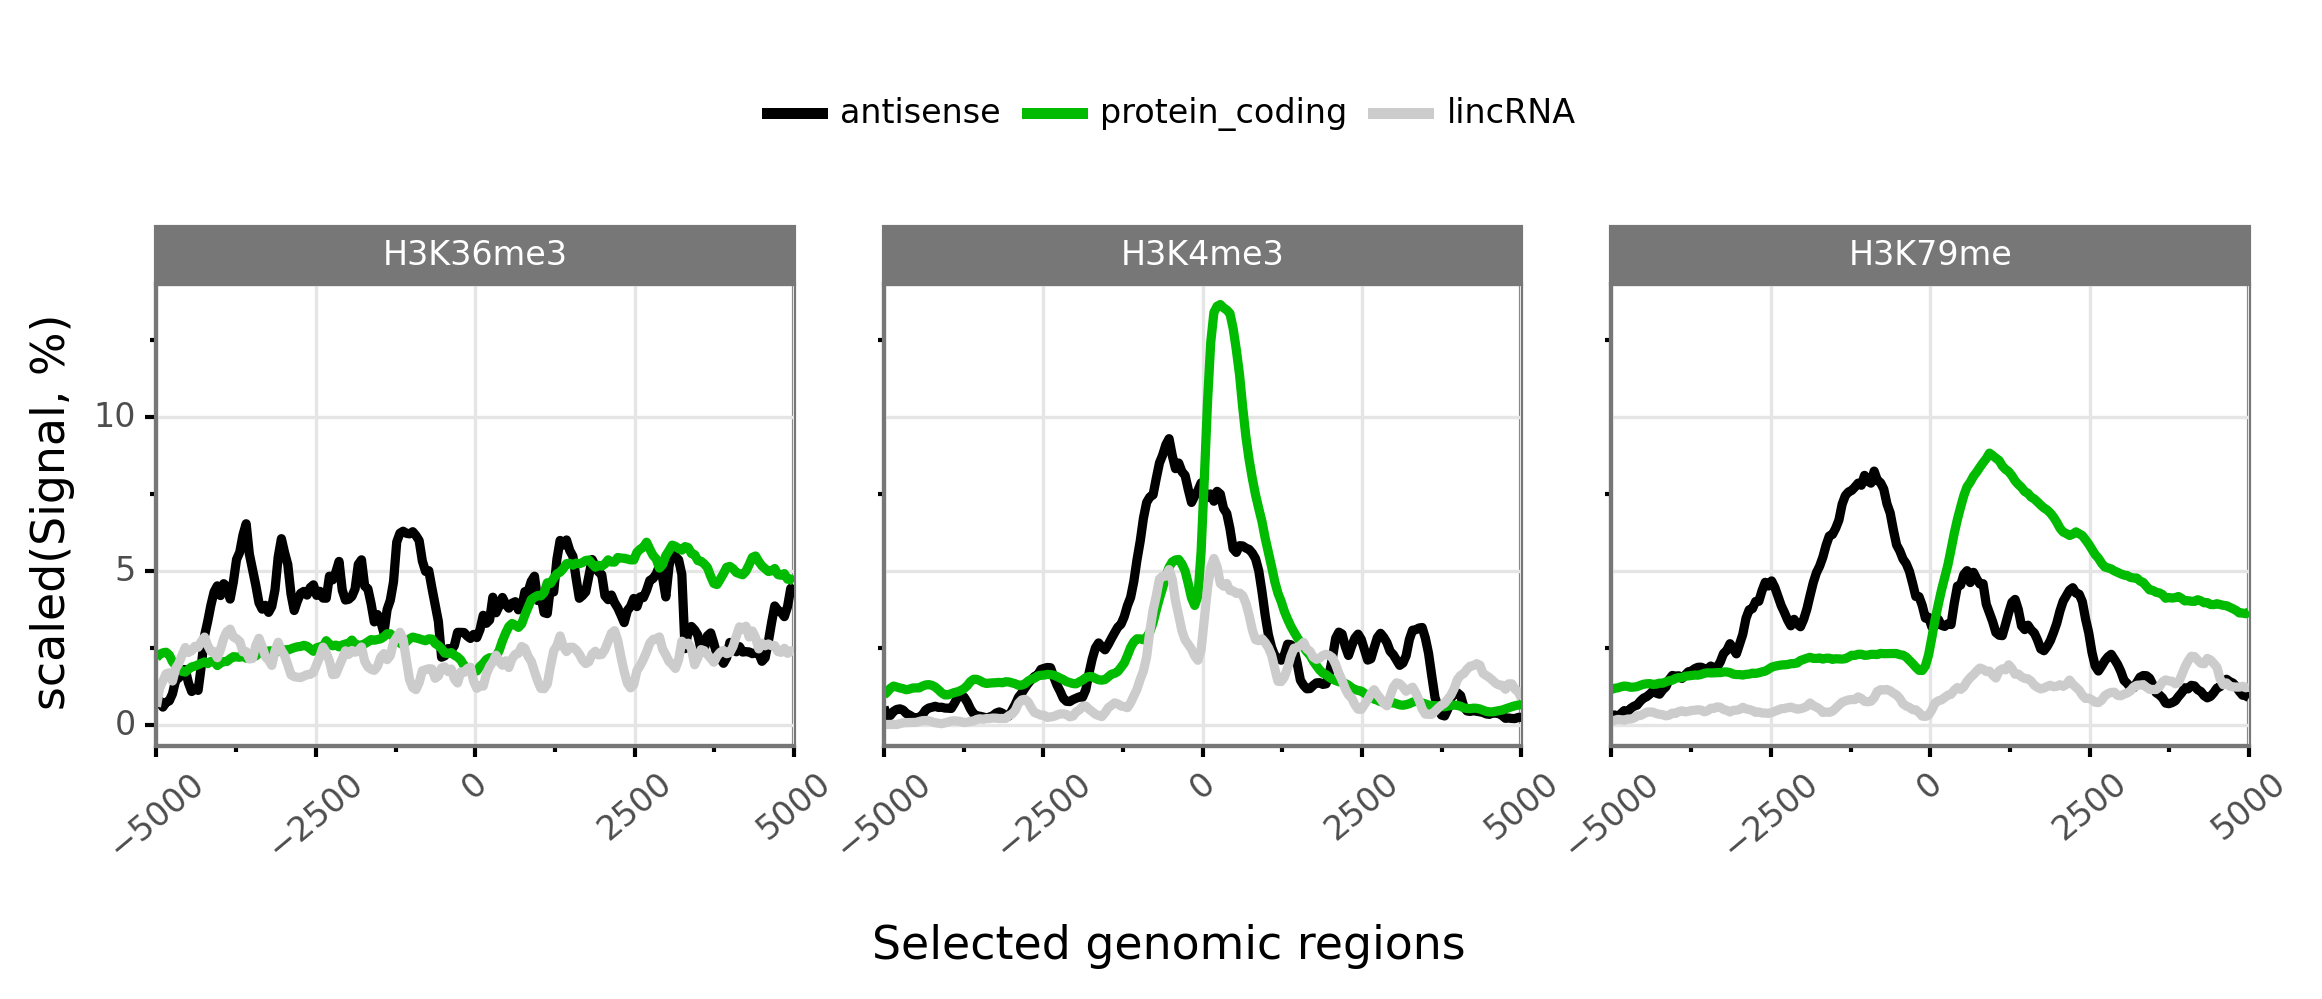
Faceted profiles
Faceted plot of epigenetic profiles. The groups (i.e colors/lines) can be set to bwig classes and the facets to transcript classes. Things can be simply done by providing an additional file containing the transcript and their associated classes.
Example:
$ gtftk profile -D -i mini_real_promoter.zip -f tx_classes -g bwig  -t tx_classes.txt -o profile_prom  -pf png -if  example_05.png -e -V 2 -fc 2
 |-- 10:50-DEBUG-profile : Using pandas version 1.4.1
 |-- 10:50-DEBUG-profile : Pandas location /Users/puthier/anaconda3/envs/pygtftk_py3.9_dev/lib/python3.9/site-packages/pandas/__init__.py
 |-- 10:50-DEBUG-profile : Using numpy version 1.22.2
 |-- 10:50-DEBUG-profile : Pandas numpy /Users/puthier/anaconda3/envs/pygtftk_py3.9_dev/lib/python3.9/site-packages/numpy/__init__.py
 |-- 10:50-DEBUG-profile : Using plotnine version 0.8.0
 |-- 10:50-DEBUG-profile : Pandas plotnine /Users/puthier/anaconda3/envs/pygtftk_py3.9_dev/lib/python3.9/site-packages/plotnine/__init__.py
 |-- 10:50-DEBUG-profile : Creating directory : /var/folders/zy/wl3dj2_n76zfc8sdvny1q06c0000gn/T/profile_matrix__pygtftk_8t5wfp3l
 |-- 10:50-DEBUG-profile : Uncompressing : /var/folders/zy/wl3dj2_n76zfc8sdvny1q06c0000gn/T/profile_matrix__pygtftk_8t5wfp3l
 |-- 10:50-DEBUG-profile : Reading : /var/folders/zy/wl3dj2_n76zfc8sdvny1q06c0000gn/T/profile_matrix__pygtftk_8t5wfp3l/mini_real_promoter
 |-- 10:50-INFO-profile : Getting configuration info from input file.
 |-- 10:50-INFO-profile : Reading transcript file.
 |-- 10:50-INFO-profile : Deleting duplicates in transcript-file.
 |-- 10:50-INFO-profile : Checking how many transcripts where found in the transcript list.
 |-- 10:50-INFO-profile : Keeping 804 transcript out of 833 in input transcript list.
 |-- 10:50-DEBUG-profile : Color order : ['H3K79me', 'H3K36me3', 'H3K4me3']
 |-- 10:50-DEBUG-profile : Profile color : ['#000000', '#00bb00', '#cccccc']
 |-- 10:50-INFO-profile : Searching coverage columns.
 |-- 10:50-INFO-profile : Melting.
 |-- 10:50-INFO-profile : Ceiling
 |-- 10:50-INFO-profile : Computing column ordering.
 |-- 10:50-INFO-profile : Preparing diagram
 |-- 10:50-INFO-profile : Theming and ordering. Please be patient...
 |-- 10:50-INFO-profile : Preparing x axis
 |-- 10:50-INFO-profile : facet_col 2
 |-- 10:50-INFO-profile : Page width set to 6
 |-- 10:50-INFO-profile : Page height set to 5.0
 |-- 10:50-INFO-profile : Saving diagram to file : example_05.png
 |-- 10:50-INFO-profile : Be patient. This may be long for large datasets.
 |-- 10:50-DEBUG-profile : Deleting temp file : /var/folders/zy/wl3dj2_n76zfc8sdvny1q06c0000gn/T/profile_matrix__pygtftk_8t5wfp3l
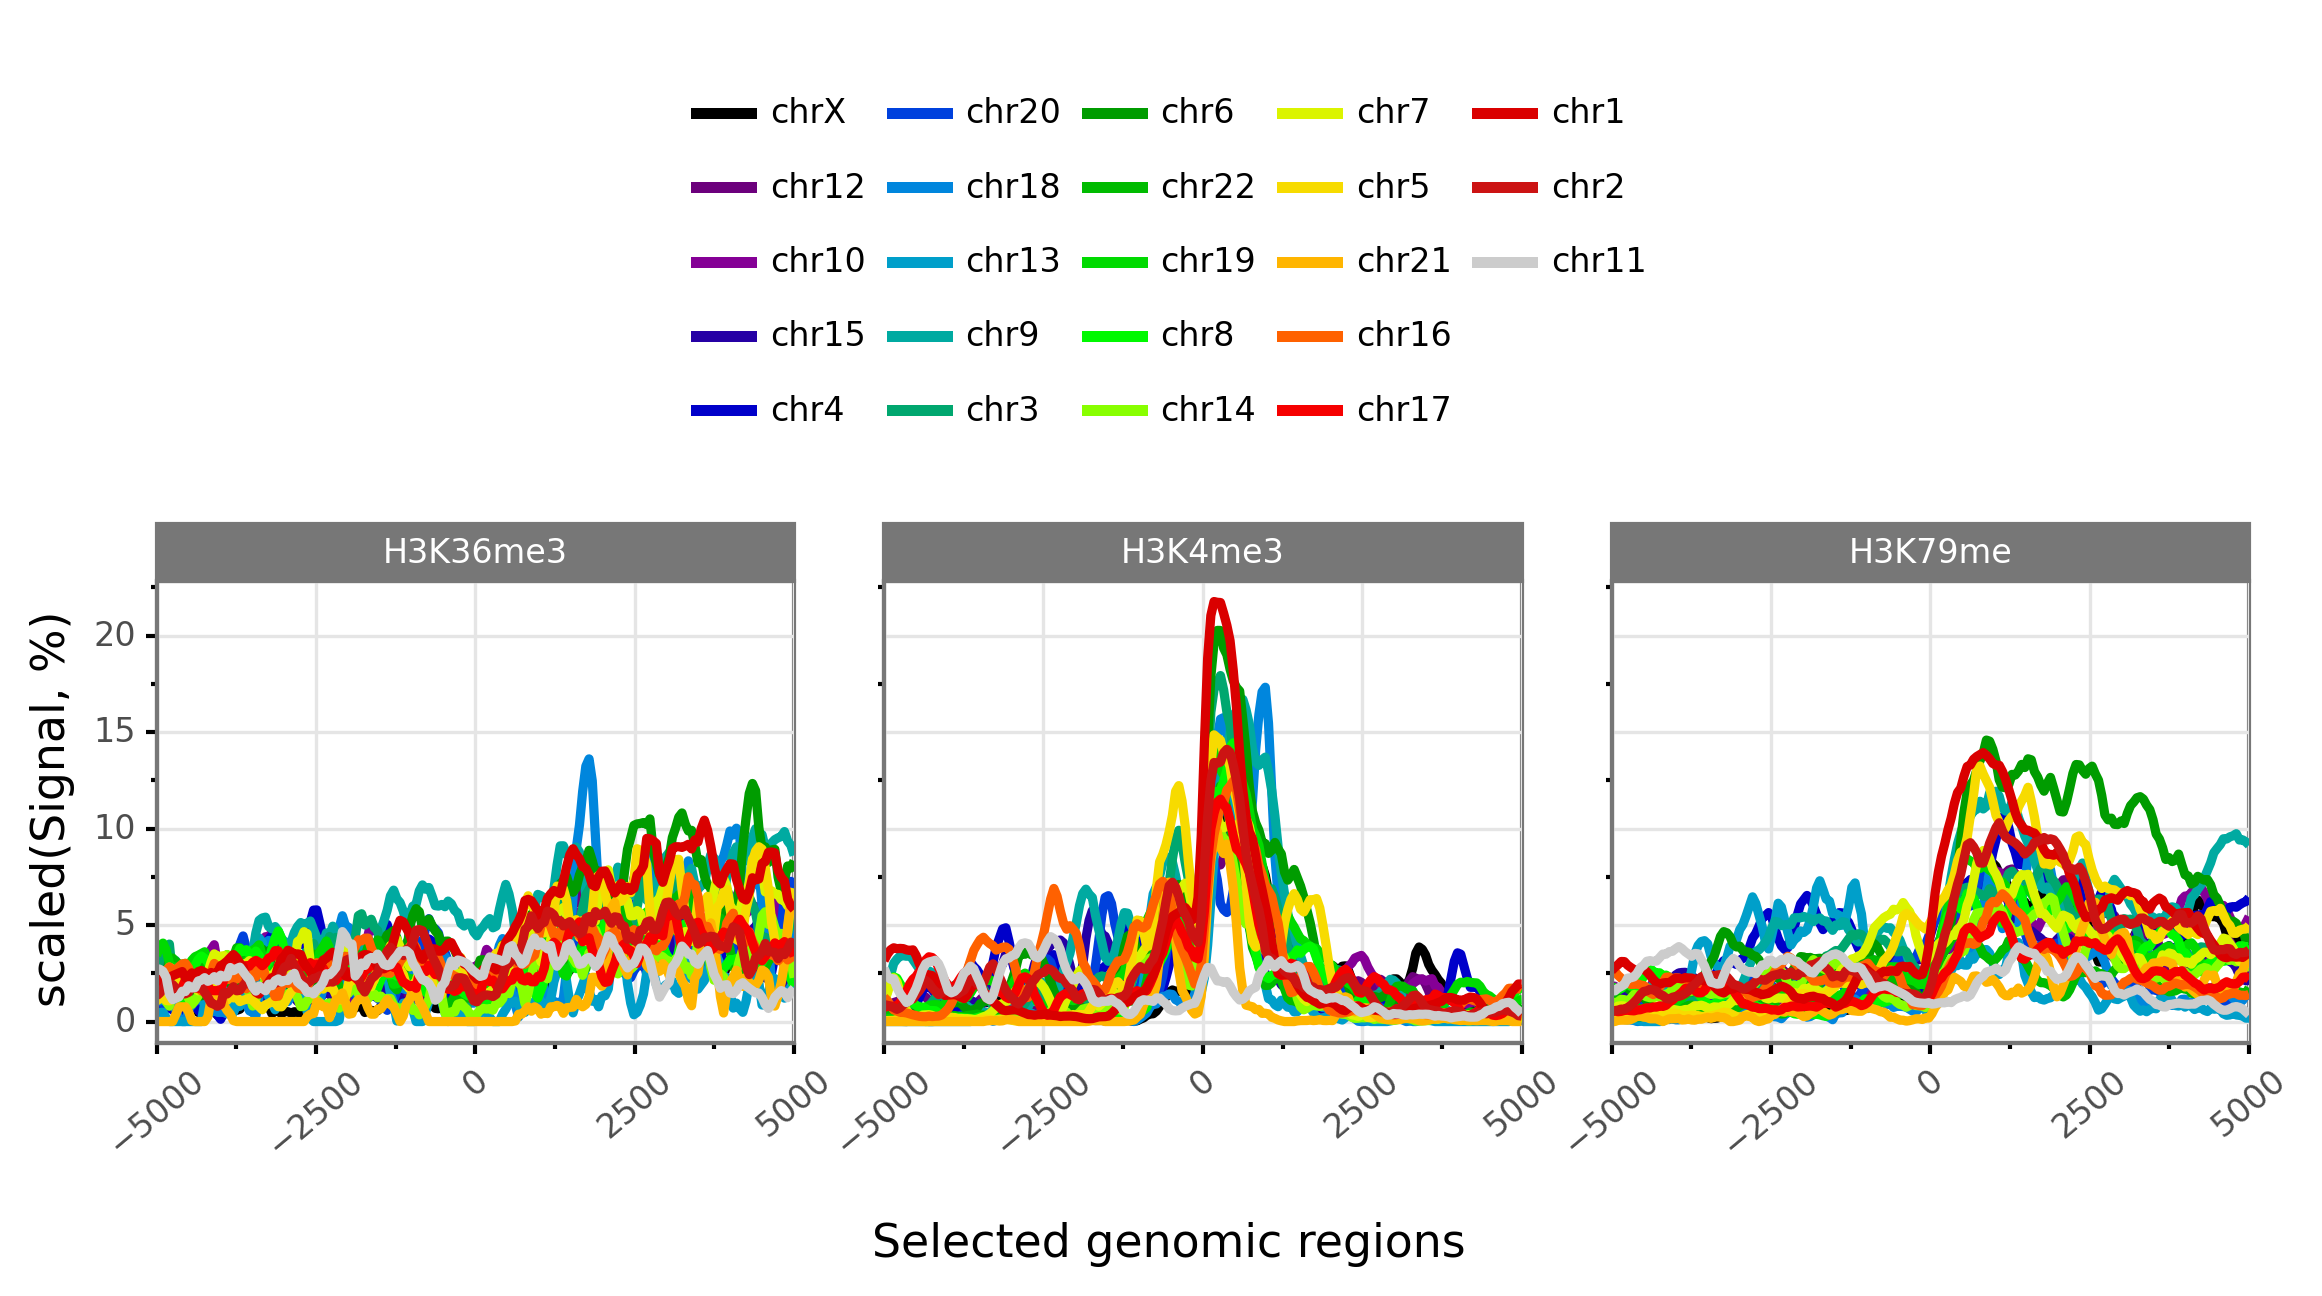
Alternatively, the groups can be set to chromosomes or transcript classes:
$ gtftk profile -D -i mini_real_promoter.zip -g tx_classes -f bwig  -t tx_classes.txt -o profile_prom  -pf png -if  example_06.png -V 2 -nm ranging
 |-- 10:50-DEBUG-profile : Using pandas version 1.4.1
 |-- 10:50-DEBUG-profile : Pandas location /Users/puthier/anaconda3/envs/pygtftk_py3.9_dev/lib/python3.9/site-packages/pandas/__init__.py
 |-- 10:50-DEBUG-profile : Using numpy version 1.22.2
 |-- 10:50-DEBUG-profile : Pandas numpy /Users/puthier/anaconda3/envs/pygtftk_py3.9_dev/lib/python3.9/site-packages/numpy/__init__.py
 |-- 10:50-DEBUG-profile : Using plotnine version 0.8.0
 |-- 10:50-DEBUG-profile : Pandas plotnine /Users/puthier/anaconda3/envs/pygtftk_py3.9_dev/lib/python3.9/site-packages/plotnine/__init__.py
 |-- 10:50-DEBUG-profile : Creating directory : /var/folders/zy/wl3dj2_n76zfc8sdvny1q06c0000gn/T/profile_matrix__pygtftk_ybjjmnt7
 |-- 10:50-DEBUG-profile : Uncompressing : /var/folders/zy/wl3dj2_n76zfc8sdvny1q06c0000gn/T/profile_matrix__pygtftk_ybjjmnt7
 |-- 10:50-DEBUG-profile : Reading : /var/folders/zy/wl3dj2_n76zfc8sdvny1q06c0000gn/T/profile_matrix__pygtftk_ybjjmnt7/mini_real_promoter
 |-- 10:50-INFO-profile : Getting configuration info from input file.
 |-- 10:50-INFO-profile : Reading transcript file.
 |-- 10:50-INFO-profile : Deleting duplicates in transcript-file.
 |-- 10:50-INFO-profile : Checking how many transcripts where found in the transcript list.
 |-- 10:50-INFO-profile : Keeping 804 transcript out of 833 in input transcript list.
 |-- 10:50-DEBUG-profile : Color order : ['antisense', 'protein_coding', 'lincRNA']
 |-- 10:50-DEBUG-profile : Profile color : ['#000000', '#00bb00', '#cccccc']
 |-- 10:50-INFO-profile : Searching coverage columns.
 |-- 10:50-INFO-profile : Melting.
 |-- 10:50-INFO-profile : Ceiling
 |-- 10:50-INFO-profile : Normalizing (ranging)
 |-- 10:50-INFO-profile : Computing column ordering.
 |-- 10:50-INFO-profile : Preparing diagram
 |-- 10:50-INFO-profile : Theming and ordering. Please be patient...
 |-- 10:50-INFO-profile : Preparing x axis
 |-- 10:50-INFO-profile : facet_col 3
 |-- 10:50-INFO-profile : Page width set to 9
 |-- 10:50-INFO-profile : Page height set to 2.0
 |-- 10:50-INFO-profile : Saving diagram to file : example_06.png
 |-- 10:50-INFO-profile : Be patient. This may be long for large datasets.
 |-- 10:50-DEBUG-profile : Deleting temp file : /var/folders/zy/wl3dj2_n76zfc8sdvny1q06c0000gn/T/profile_matrix__pygtftk_ybjjmnt7
$ gtftk profile -D -i mini_real_promoter.zip -g chrom -f bwig  -t tx_classes.txt -o profile_prom  -pf png -if  example_06b.png -V 2 -nm ranging
 |-- 10:50-DEBUG-profile : Using pandas version 1.4.1
 |-- 10:50-DEBUG-profile : Pandas location /Users/puthier/anaconda3/envs/pygtftk_py3.9_dev/lib/python3.9/site-packages/pandas/__init__.py
 |-- 10:50-DEBUG-profile : Using numpy version 1.22.2
 |-- 10:50-DEBUG-profile : Pandas numpy /Users/puthier/anaconda3/envs/pygtftk_py3.9_dev/lib/python3.9/site-packages/numpy/__init__.py
 |-- 10:50-DEBUG-profile : Using plotnine version 0.8.0
 |-- 10:50-DEBUG-profile : Pandas plotnine /Users/puthier/anaconda3/envs/pygtftk_py3.9_dev/lib/python3.9/site-packages/plotnine/__init__.py
 |-- 10:50-DEBUG-profile : Creating directory : /var/folders/zy/wl3dj2_n76zfc8sdvny1q06c0000gn/T/profile_matrix__pygtftk_sk15z7l6
 |-- 10:50-DEBUG-profile : Uncompressing : /var/folders/zy/wl3dj2_n76zfc8sdvny1q06c0000gn/T/profile_matrix__pygtftk_sk15z7l6
 |-- 10:50-DEBUG-profile : Reading : /var/folders/zy/wl3dj2_n76zfc8sdvny1q06c0000gn/T/profile_matrix__pygtftk_sk15z7l6/mini_real_promoter
 |-- 10:50-INFO-profile : Getting configuration info from input file.
 |-- 10:50-DEBUG-profile : Color order : ['chrX', 'chr12', 'chr10', 'chr15', 'chr4', 'chr20', 'chr18', 'chr13', 'chr9', 'chr3', 'chr6', 'chr22', 'chr19', 'chr8', 'chr14', 'chr7', 'chr5', 'chr21', 'chr16', 'chr17', 'chr1', 'chr2', 'chr11']
 |-- 10:50-DEBUG-profile : Profile color : ['#000000', '#6c007c', '#850096', '#2500a5', '#0000ca', '#0041dd', '#0086dd', '#009fca', '#00aaa1', '#00a76f', '#009c00', '#00bb00', '#00da00', '#00f900', '#88ff00', '#dbf400', '#f7db00', '#ffb500', '#ff6100', '#f60000', '#da0000', '#cc1313', '#cccccc']
 |-- 10:50-INFO-profile : Searching coverage columns.
 |-- 10:50-INFO-profile : Melting.
 |-- 10:50-INFO-profile : Ceiling
 |-- 10:50-INFO-profile : Normalizing (ranging)
 |-- 10:51-INFO-profile : Computing column ordering.
 |-- 10:51-INFO-profile : Preparing diagram
 |-- 10:51-INFO-profile : Theming and ordering. Please be patient...
 |-- 10:51-INFO-profile : Preparing x axis
 |-- 10:51-INFO-profile : facet_col 3
 |-- 10:51-INFO-profile : Page width set to 9
 |-- 10:51-INFO-profile : Page height set to 2.0
 |-- 10:51-INFO-profile : Saving diagram to file : example_06b.png
 |-- 10:51-INFO-profile : Be patient. This may be long for large datasets.
 |-- 10:51-DEBUG-profile : Deleting temp file : /var/folders/zy/wl3dj2_n76zfc8sdvny1q06c0000gn/T/profile_matrix__pygtftk_sk15z7l6
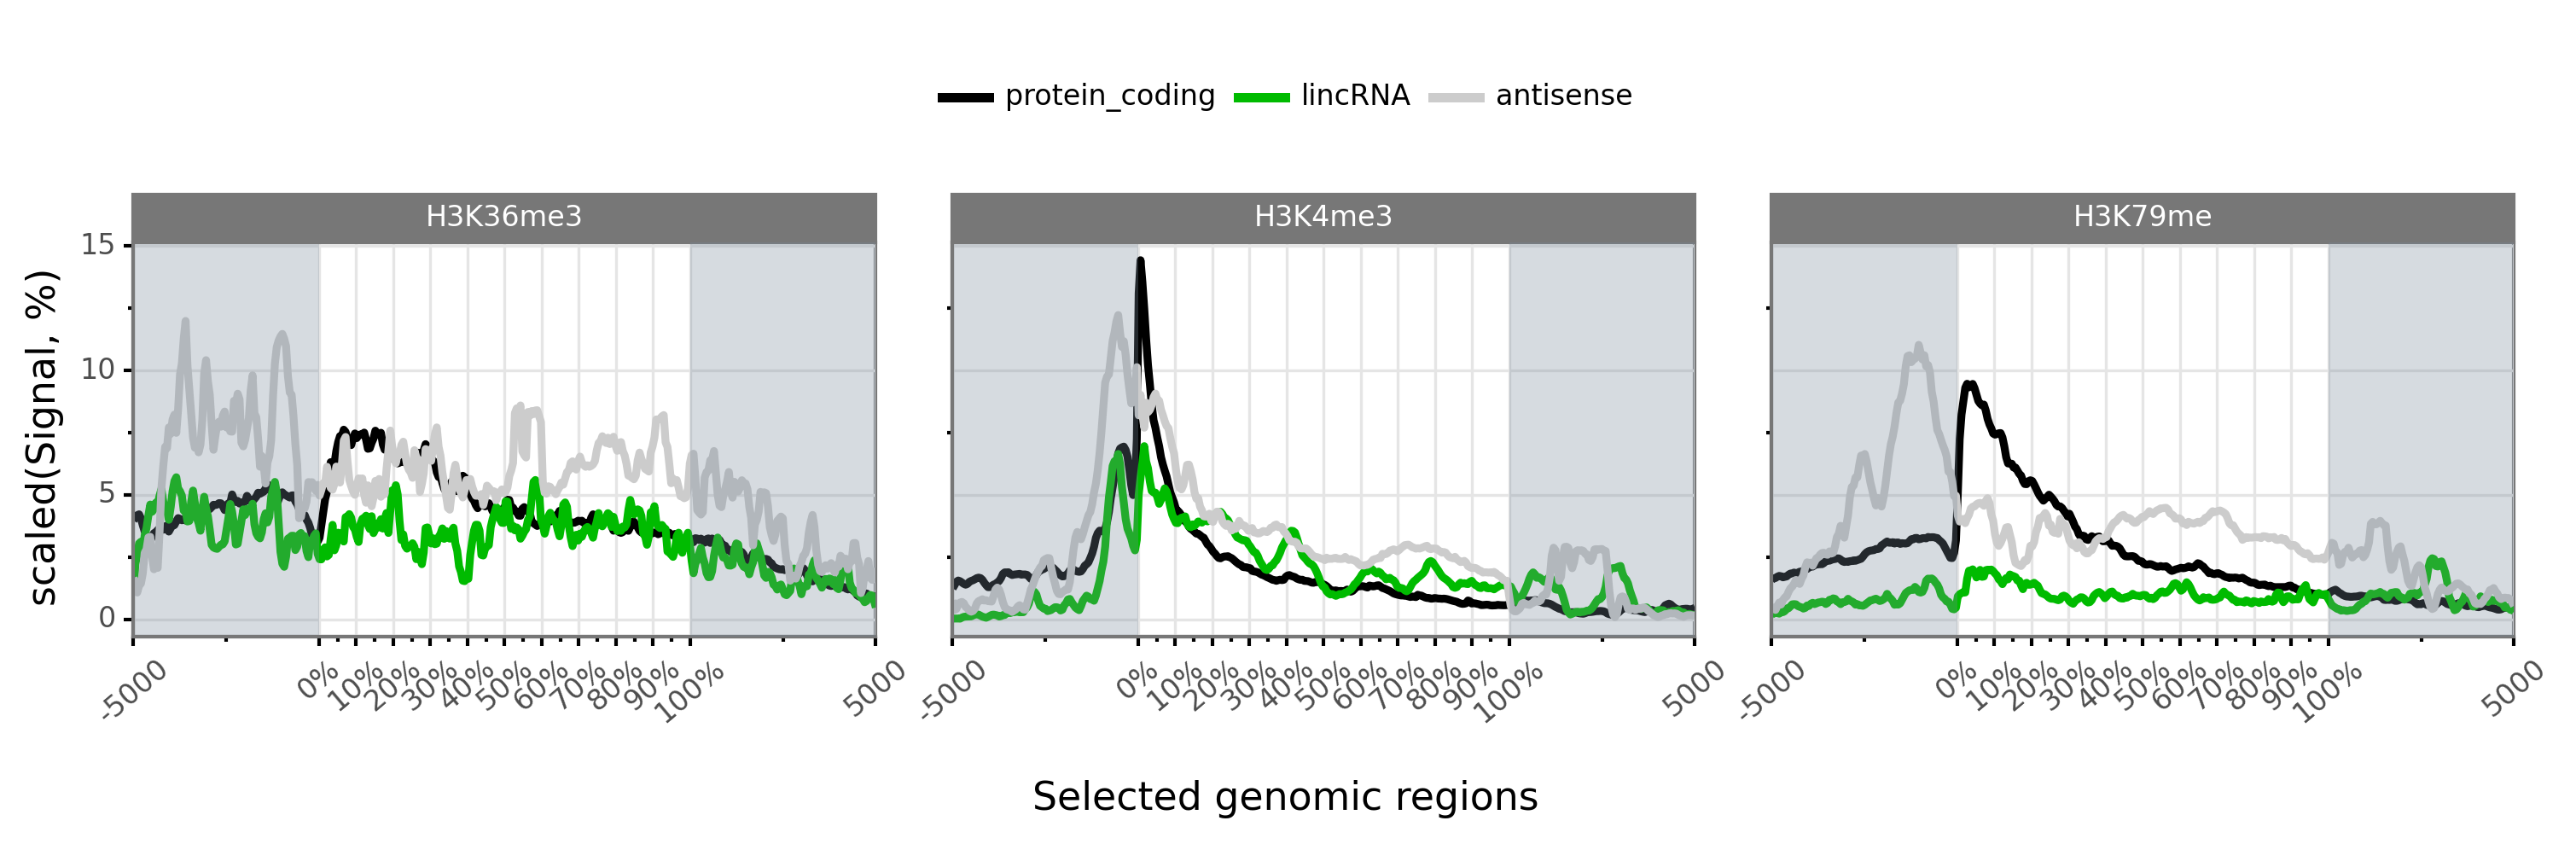
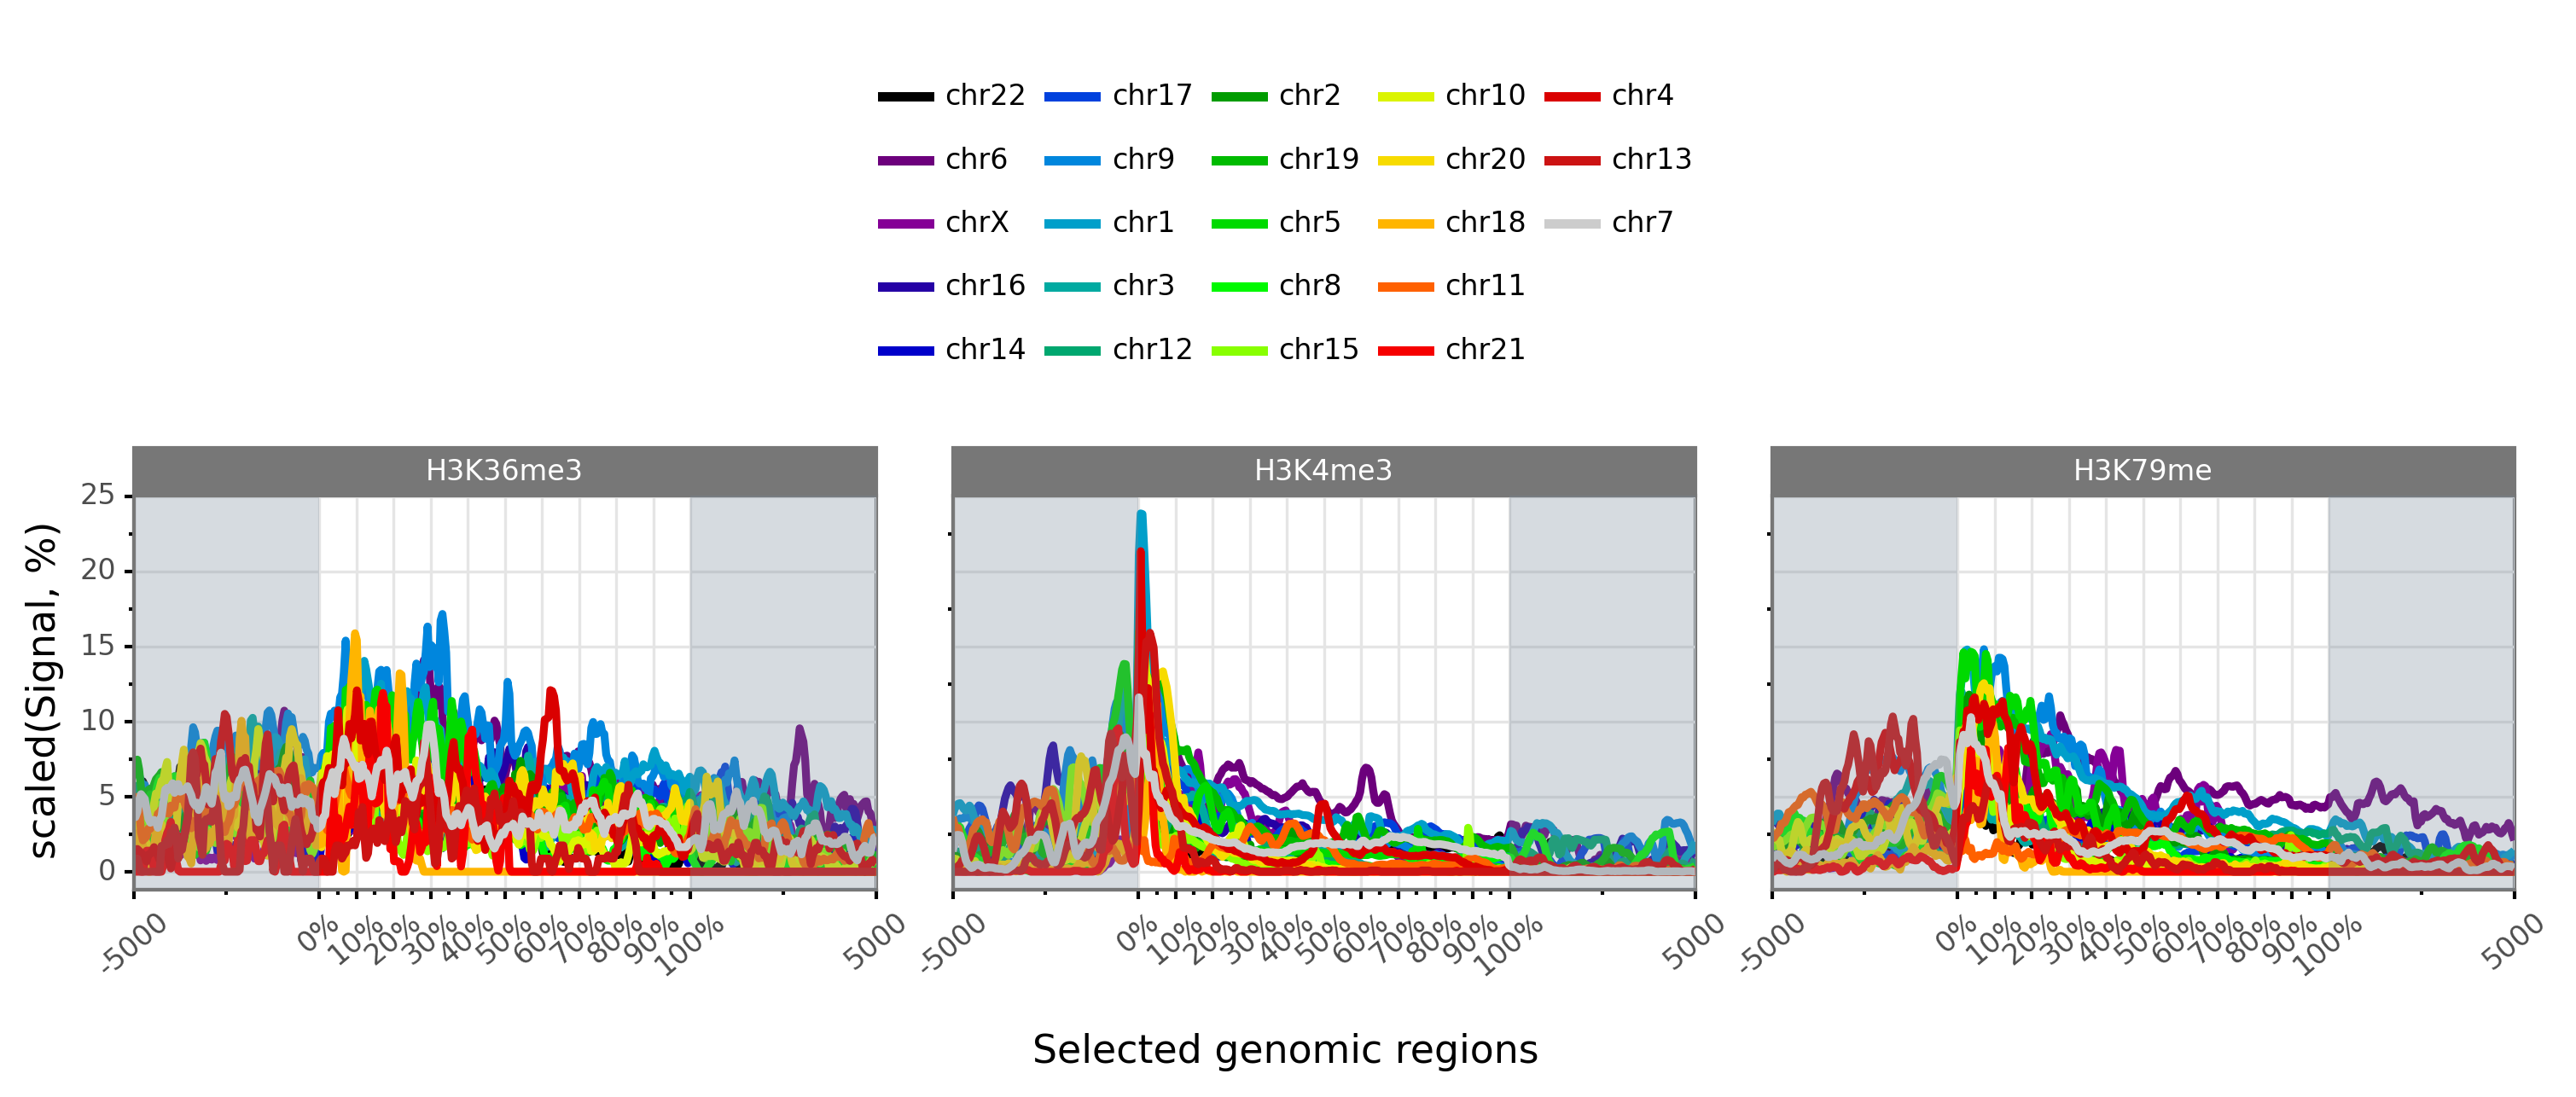
Note that facets may also be associated to epigenetic marks. In this case each the –group-by can be set to tx_classes or chrom.
$ gtftk profile -D -i mini_real_tx.zip -g tx_classes -t tx_classes.txt -f bwig  -o profile_tx -pf png -if  example_07.png -w -nm ranging
/Users/puthier/anaconda3/envs/pygtftk_py3.9_dev/lib/python3.9/site-packages/pygtftk-1.6.2-py3.9-macosx-10.9-x86_64.egg/pygtftk/plugins/profile.py:890: FutureWarning: Index.ravel returning ndarray is deprecated; in a future version this will return a view on self.
 |-- 10:51-WARNING-profile : PlotnineError error, can not show group number: Aesthetics {'ha'} specified two times.
$ gtftk profile -D -i mini_real_tx.zip -g chrom -f bwig  -o profile_tx -pf png -if  example_08.png  -w -nm ranging
/Users/puthier/anaconda3/envs/pygtftk_py3.9_dev/lib/python3.9/site-packages/pygtftk-1.6.2-py3.9-macosx-10.9-x86_64.egg/pygtftk/plugins/profile.py:890: FutureWarning: Index.ravel returning ndarray is deprecated; in a future version this will return a view on self.
 |-- 10:51-WARNING-profile : PlotnineError error, can not show group number: Aesthetics {'ha'} specified two times.
$ gtftk profile -h
  Usage: gtftk profile -i MATRIX [-o DIR] [-t transcript_file] [-s {mean,median,sum,min,max}] [-e] [-c profile_colors] [-d color_order] [-g {bwig,tx_classes,chrom}] [-f {bwig,tx_classes,chrom}] [-pw page_width] [-ph page_height] [-pf {pdf,png}] [-lw line_width] [-bc border_color] [-x x_lab] [-at axis_text] [-st strip_text] [-u subset_bwig] [-fc facet_col] [-w] [-if user_img_file] [-ul upper_limit] [-nm {none,ranging}] [-tl] [-ti title] [-dpi dpi] [-th {538,bw,grey,gray,linedraw,light,dark,minimal,classic,void,test,matplotlib,seaborn}] [-m palette] [-l] [-h] [-V [verbosity]] [-D] [-C] [-K tmp_dir] [-A] [-L logger_file] [-W write_message_to_file]

  Description:

     Produces bigWig coverage profiles using calls to plotnine graphic package.

  Notes:
     *  Think about using normalized bigWig files as input to mk_matrix. This will limit the
     requirement for an additional normalization step (see Deeptools for a set of useful methods
     implemented in bamCoverage/bamCompare).

  References:
     *  [1] Numerical Ecology - second Edition - P. Legendre, L. Legendre (1998) Elsevier.

Arguments:
 -i, --inputfile              A zip file containing a matrix as produced by mk_matrix. (default: None)
 -o, --out-dir                Output directory name. (default: draw_profile)
 -t, --transcript-file        A two columns file with the transcripts of interest and their classes. (default: None)
 -s, --stat                   The statistics to be computed. (default: mean)
 -e, --confidence-interval    Add a confidence interval to estimate standard error of the mean. (default: False)
 -c, --profile-colors         Colors. (default: None)
 -d, --color-order            Factor ordering. comma-separated bwig labels or tx classes. (default: None)
 -g, --group-by               The variable used for grouping. (default: None)
 -f, --facet-var              The variable to be used for splitting into facets. (default: None)
 -pw, --page-width            Output pdf file width (e.g. 7 inches). (default: None)
 -ph, --page-height           Output file height (e.g. 5 inches). (default: None)
 -pf, --page-format           Output file format. (default: pdf)
 -lw, --line-width            Line width. (default: 1.25)
 -bc, --border-color          Border color for the plot. (default: #777777)
 -x, --x-lab                  X axis label. (default: Selected genomic regions)
 -at, --axis-text             Size of axis text. (default: 8)
 -st, --strip-text            Size of strip text. (default: 8)
 -u, --subset-bwig            Use only a subset of the bigwigs for plotting (default: None)
 -fc, --facet-col             Number of facet columns. (default: 4)
 -w, --show-group-number      Show the number of element per group (groupe size). (default: False)
 -if, --user-img-file         Provide an alternative path for the image. (default: None)
 -ul, --upper-limit           Upper limit based on quantile computed from unique values. (default: 0.95)
 -nm, --normalization-method  The normalization method performed on a per bigwig basis. (default: none)
 -tl, --to-log                Control whether the data should be log2-transform before plotting. (default: False)
 -ti, --title                 A title for the diagram. (default: )
 -dpi, --dpi                  Dpi to use. (default: 300)
 -th, --theme-plotnine        The theme for plotnine diagram. (default: bw)
 -m, --palette                A color palette (see: https://tinyurl.com/ydacyfxx). (default: nipy_spectral)
 -l, --list-bwig              List the bigwig files in the matrix file.. (default: False)

Command-wise optional arguments:
 -h, --help                   Show this help message and exit.
 -V, --verbosity              Set output verbosity ([0-3]). (default: 0)
 -D, --no-date                Do not add date to output file names. (default: False)
 -C, --add-chr                Add 'chr' to chromosome names before printing output. (default: False)
 -K, --tmp-dir                Keep all temporary files into this folder. (default: None)
 -A, --keep-all               Try to keep all temporary files even if process does not terminate normally. (default: False)
 -L, --logger-file            Stores the arguments passed to the command into a file. (default: None)
 -W, --write-message-to-file  Store all message into a file. (default: None)